Real GDP grew 0.4% in the June quarter, taking the economy to $699.5 billion — but the two-year rise has been uneven, with no clear acceleration or slowdown either way.
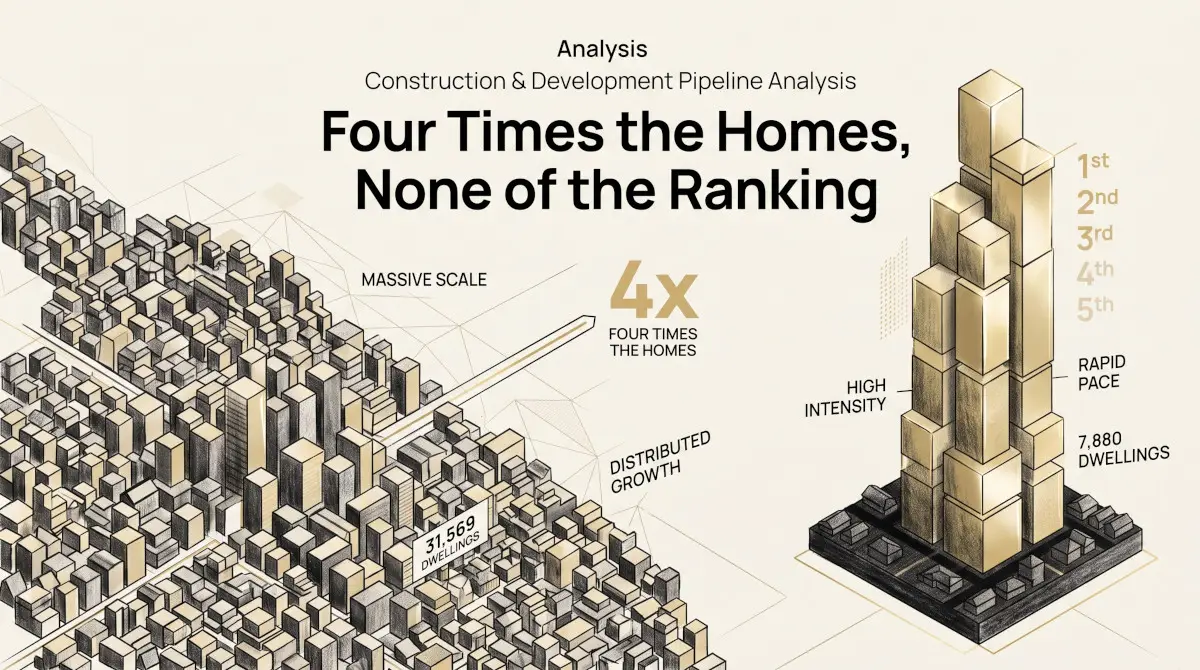
Queensland ranks nowhere on the national building-intensity leaderboard — yet its top five council areas approved four times more homes than Western Australia's leading five. Two very different shapes of the same national boom.
Four years of ABS approvals data show Australia's two biggest states building barely more homes than they did in 2022, while Western Australia's per-capita rate has climbed every single year. New South Wales' own migration numbers suggest why.
Headline CPI eased to 3.5% in July 2026, but the Trimmed Mean held at 3.6% -- now above headline for the first time this cycle. Housing remains the largest contributor to annual inflation, and New Dwelling Purchase costs are the...
Australias unemployment rate has risen 0.38 points off its January 2026 floor, with a 4.4-point spread across regions -- and a two-quarter pullback in investor lending concentration arriving in the same window.
Public sector wages have outgrown private for six straight quarters. But the gap itself swings wildly quarter to quarter -- and over the full five-year picture, private sector pay is still narrowly ahead overall.
Real wages fell 0.75 percentage points over the year to June 2026 -- but the quarterly real-wage sign flipped four times in a row, driven by CPI volatility rather than any instability in wage growth itself.
Newly loaded 56-year BIS data shows nominal Australian house prices are up 18% since their March 2022 peak -- but in CPI-adjusted real terms, the national price level in Q1 2026 is back to almost exactly where it stood before...
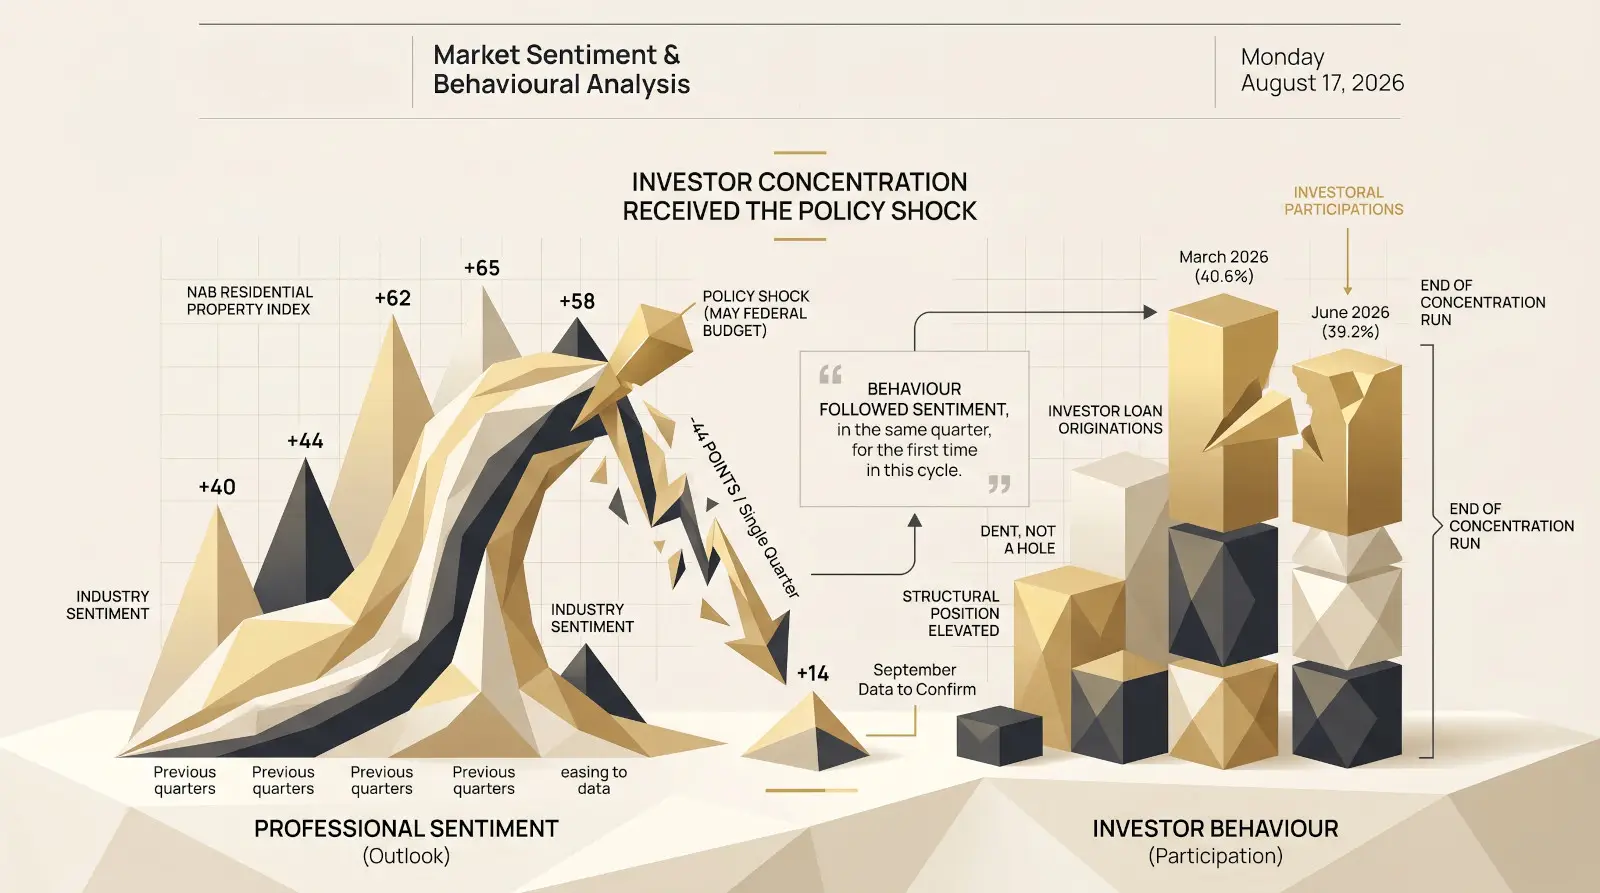
Five days before the June-quarter Lending Indicators, APN stated a pre-registered test: would investor behaviour follow the 44-point fall in industry sentiment after the May Budget's investor-housing tax changes? The answer arrived on 14 August — the Investor Concentration Ratio...
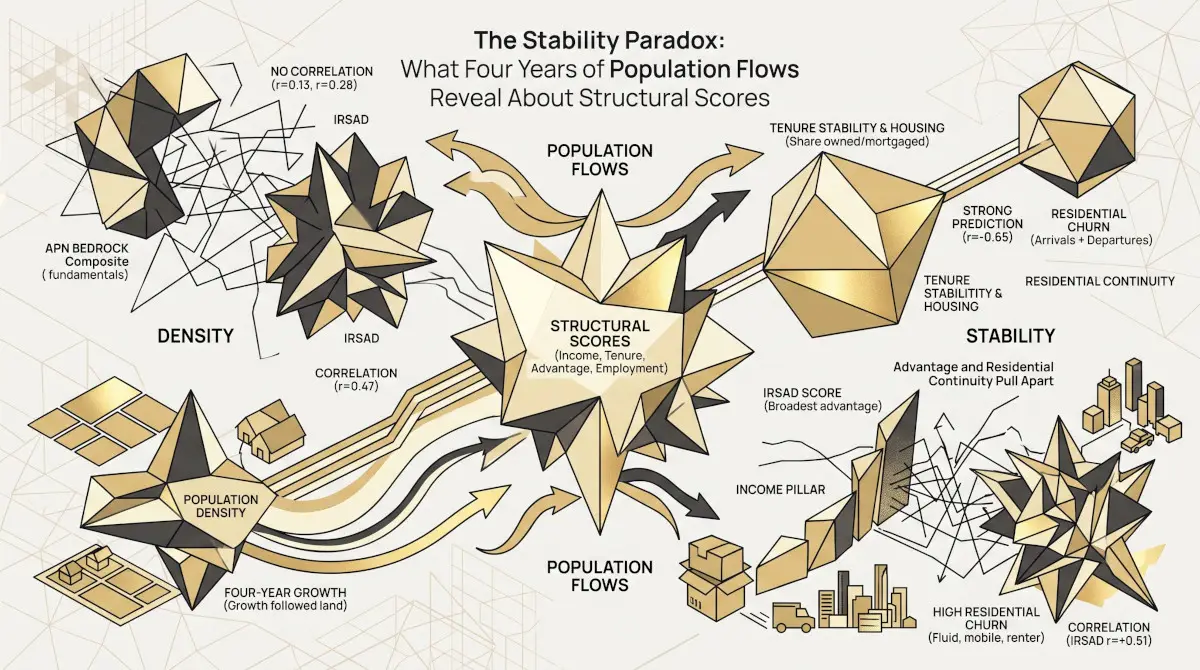
Structural scores measured in 2021 predicted essentially nothing about where Australia's population grew over the following four years — density did. But residential stability was predictable, by one measure: tenure structure anticipated four years of churn at r = −0.54....
Across 517 comparable LGAs matched to the ratified 2016↔2021 census concordance, the national renter share barely moved (31.8% to 31.1%) — but 455 of 517 LGAs recorded a decline. Renting concentrated into Greater Sydney and inner Perth; the high-growth coastal...
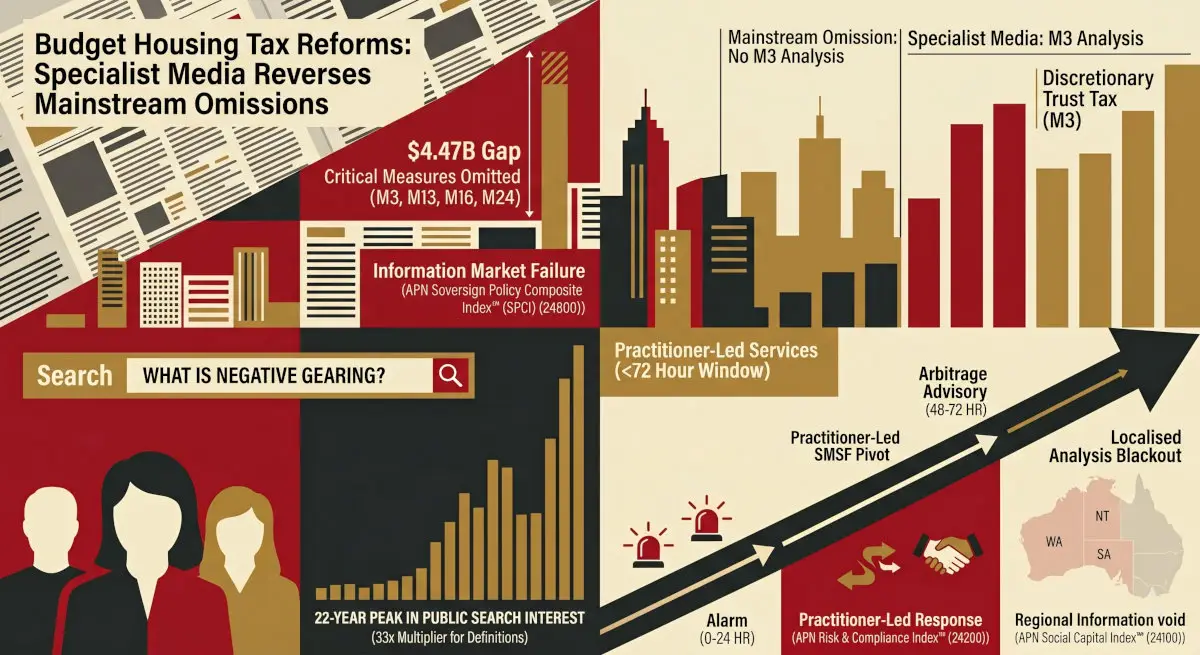
A 90-day APN retrospective finds the Australian media ecosystem amplified alarm about the 2026–27 housing tax reforms while structurally failing to communicate their protections — even as a historic majority of the electorate came to support the outcome the reforms...
APN's dedicated verification of the 2026 housing tax reforms' grandfathering provisions confirms a previously unreported structural interaction: the new 30% minimum tax can materially reduce the disposal-year cash value of grandfathered negative-gearing deductions — a novel finding, not media misreporting.
A pre-registered "downsizing dead end" hypothesis failed twice: the age–building relationship is weak and bends upward in the oldest LGAs, and 55% of over-65s live in the highest-building metro quintiles. If a dead end exists, it's product mix — not...
A pre-registered test of rising concentration in Australian housing delivery failed — and the failure is the finding. Twenty LGAs have produced ~40% of national approvals through contraction, trough and record recovery alike. The recovery broadened nothing.
The highest-volume building-approval LGAs split into two opposite tenure profiles — renter-heavy inner-metro and mortgage-heavy growth corridors — and the corridor is building proportionally faster, not just in bigger absolute numbers. The record residential construction pipeline isn't evenly distributed risk.
Outright home ownership tracks age almost perfectly across Australia's LGAs (+0.884) and tracks income negatively (−0.489). Mining boomtowns and harbour suburbs share the same high incomes but sit at opposite ends of the ownership scale — the real driver is...
June 2026 data inverts the usual assumption: households least likely to hold a mortgage are recording the fastest Housing cost growth, while mortgage interest charges barely differ across household types -- pointing to rent, rates and utilities, not financing, as...
Age Pensioner households are running hotter than PBLCI, the blended pension/benefit measure that includes them -- +0.78pp above CPI in the June 2026 quarter, driven by Housing costs, not benefit adequacy.
Approvals and commencements are falling while dwellings under construction and unfinished work value keep climbing — a combination more consistent with a delivery and finance constraint than a demand slowdown or a materials-cost shock.
Fourteen years of Residential Tenancies Authority bond data show a clean structural bifurcation: 12 of 43 Queensland LGAs more than doubled their new-tenancy median rent since 2012, while 8 went backwards in nominal terms. Once CPI-deflated, the decliner count rises...
Three ATO datasets, one reform-eve landlord class. The nation's landlords have never been older — the 60+ cohort now holds 27.5% of rental interests, up from 14.7% in 1999–2000, while under-30 landlords declined in absolute numbers. Negative gearing's loss-share reversed...
Population growth tracks building approvals closely across 546 LGAs (r = 0.952) — but Western Australia absorbs growth at 4.63 persons per approval, nearly double Victoria and NSW. Splitting population growth by migration source reveals why: inner and middle-ring Perth...
Screening ten LGAs with apparent declining approvals against their full quarterly history — not just the two headline numbers — confirms three real declines, flags one active recovery misread as a fall, and clears six false signals. An APN Codex...
Inner-urban apartment approvals fell sharply in early 2023 and rebuilt across four capitals — Melbourne, Sydney, Adelaide and Perth — not as a smooth climb but as a rising quarterly floor beneath genuinely lumpy, single-project-driven data. An APN Codex analysis...
National dwelling approvals moved through a full cycle between July 2022 and May 2026 — a 36,180 trough in early 2023, a 50,997 peak in mid-2025, and a state-level split where Western Australia kept climbing through the recent pullback while...
Population growth and building approvals correlate strongly across 70 LGAs (r = 0.84) — but 24 LGAs depart from that pattern by 1.75 dwellings per 1,000 residents or more. Eleven established, mostly high-advantage suburbs under-build relative to their own growth;...
Almost two million taxable individuals live in one of 83 LGAs where a decade of nominal income growth becomes flat-to-negative once inflation is applied. An APN LGA Intelligence analysis of a decade of ATO taxation data, CPI-deflated, across all 531...
Sydney's median taxable income grew 51.5% nominally over the decade to 2023-24 - 16.3% in real terms. Melbourne's grew 16.2% nominally, a 10.9% real-terms decline. An APN LGA Intelligence analysis of a decade of ATO taxation data, CPI-deflated, across Australia's...
Brisbane (1.375M people) and Knox (163,820) sit within 1.5 points of each other on APN Bedrock composite — 55.86 and 54.38. Across the 50 most populous LGAs, population size explains less than 0.1 per cent of the variance in Bedrock...
Eighteen of the 40 most populous LGAs are net exporters of internal migrants — losing more residents to the rest of Australia than they gain — with overseas migration masking the loss on the headline growth figure. This analysis separates...
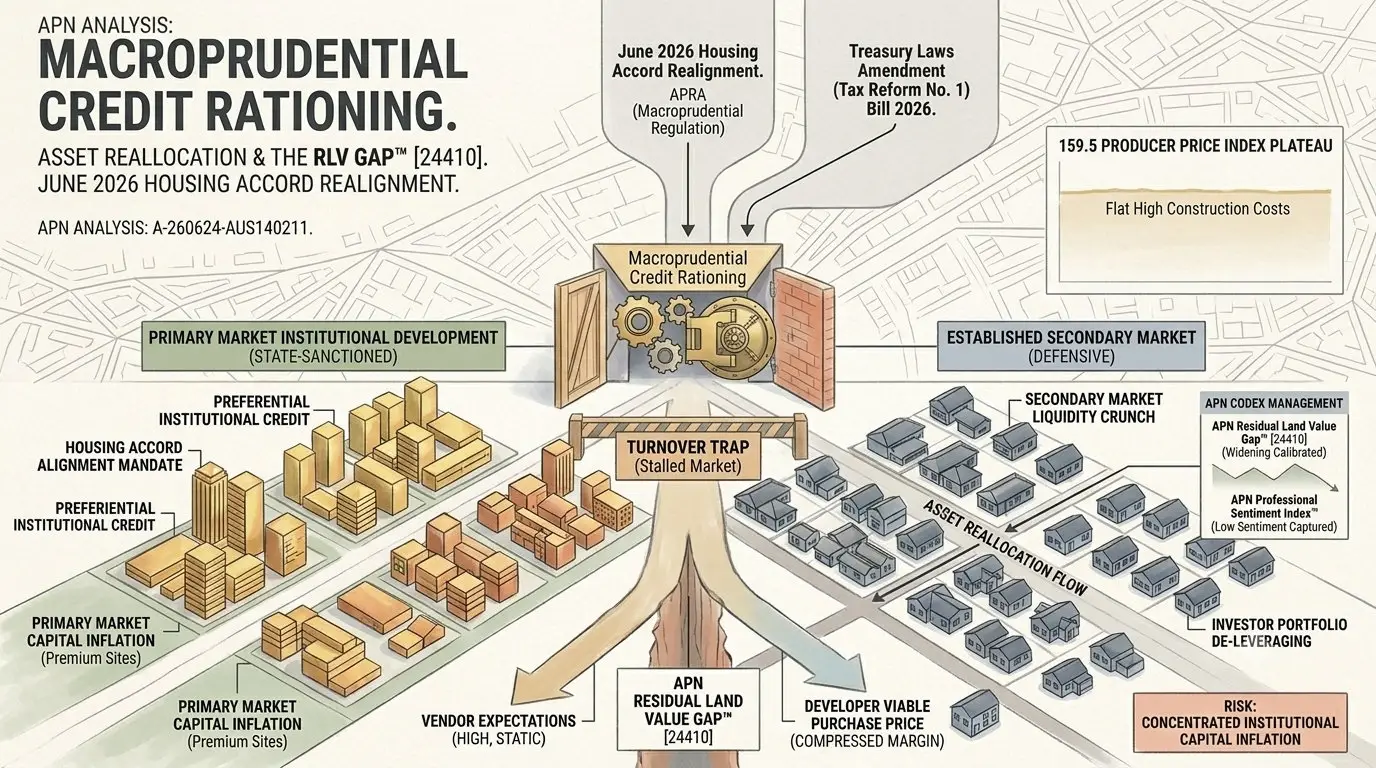
A structural asymmetry has emerged in the Australian mortgage broking sector, with record intermediary numbers confronting a contracting pool of convertible credit. APN analysis identifies that this imbalance, driven by binding macroprudential regulations, is eroding per-capita productivity and initiating a...
The Australian buyers agent sector is undergoing a structural correction following a period of rapid, less-regulated expansion. APN analysis identifies that a doubling in practitioner headcount has converged with tightening credit conditions and a contracting buyer pool, creating a structurally...
A structural misalignment between a historically large practitioner workforce and constrained transaction volumes is creating significant operational friction in the Australian real estate sector. APN analysis quantifies this overservice, revealing an implied national average of 3.32 transactions per agent per...
A structural divergence is reshaping the Australian real estate professional services sector. APN analysis identifies a material oversupply of practitioners, with record headcounts across broking and agency cohorts competing for a transaction pool that has been constrained by macroprudential credit...
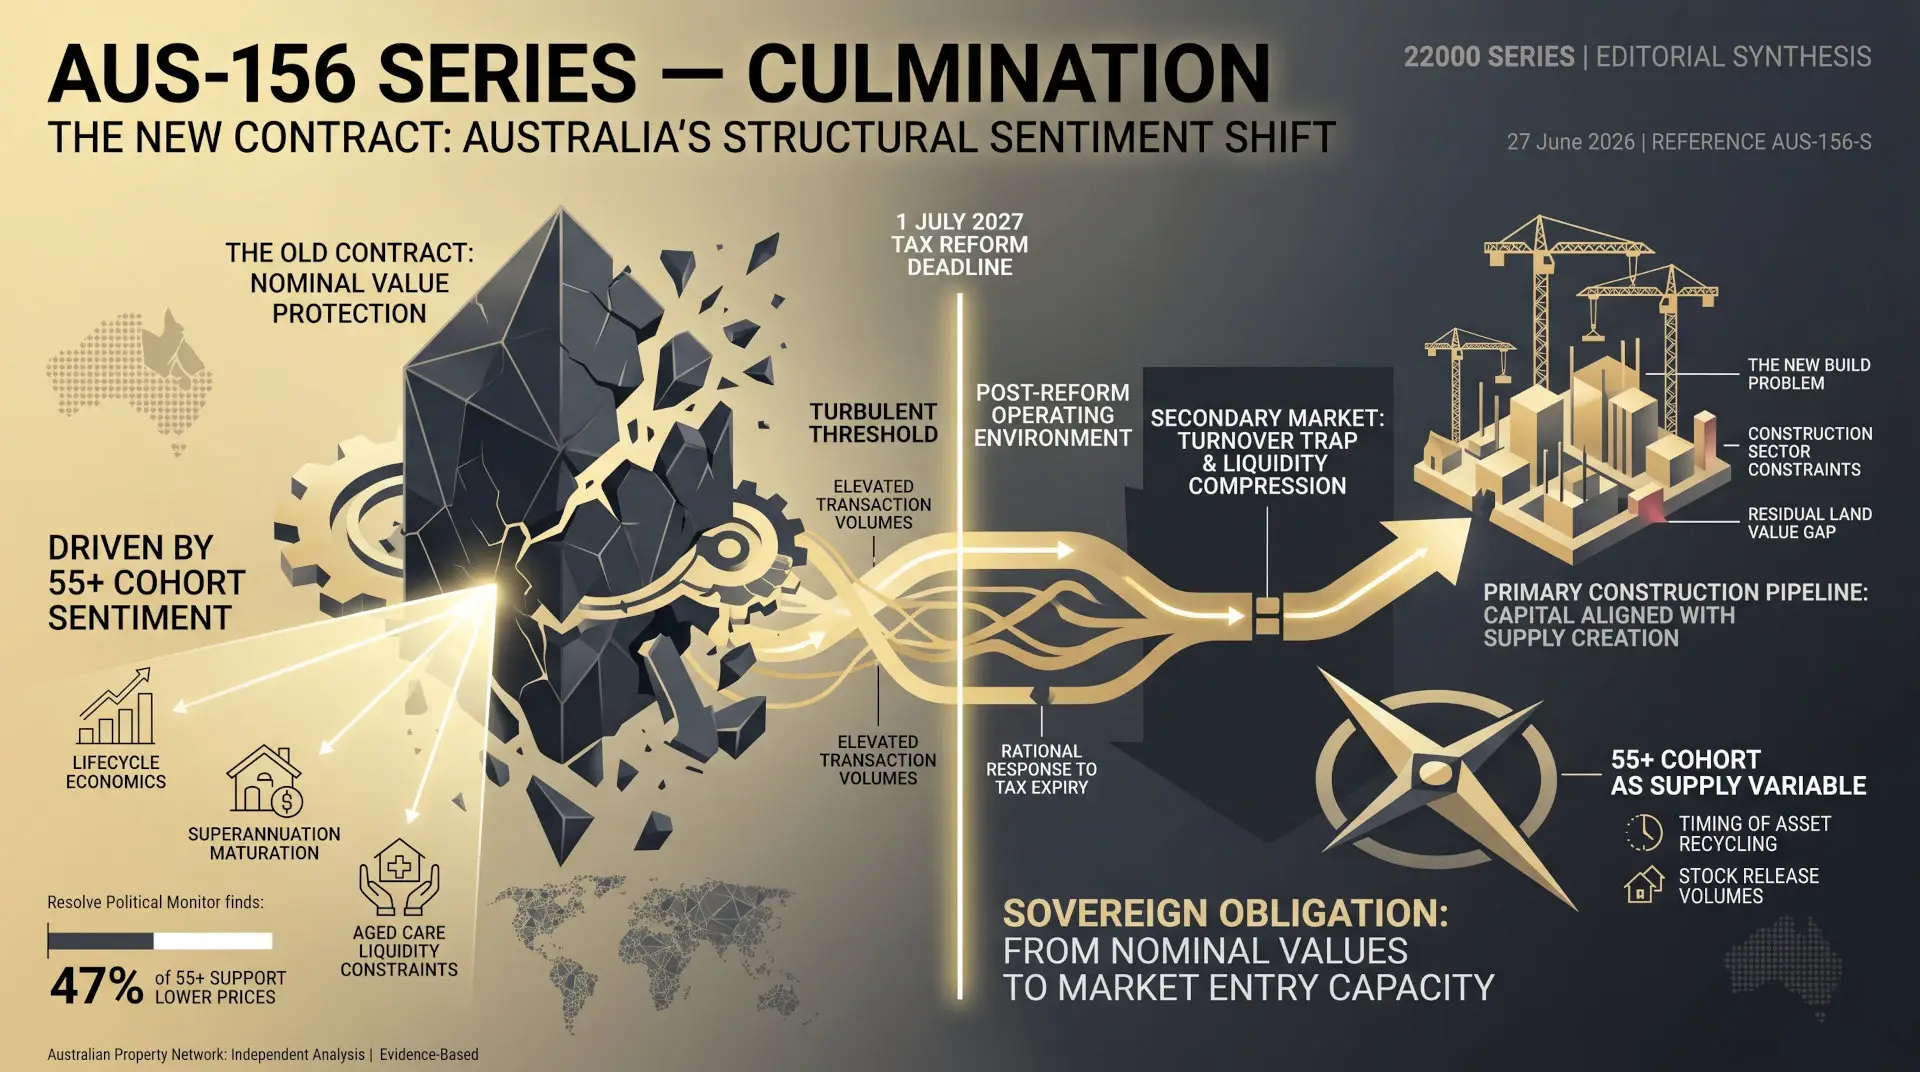
The implicit sovereign guarantee underwriting three decades of Australian property values has structurally expired. This editorial maps the transition — the turbulent threshold ahead, the capital reallocation problem, and the operating environment that will define the market from 2027 onward.
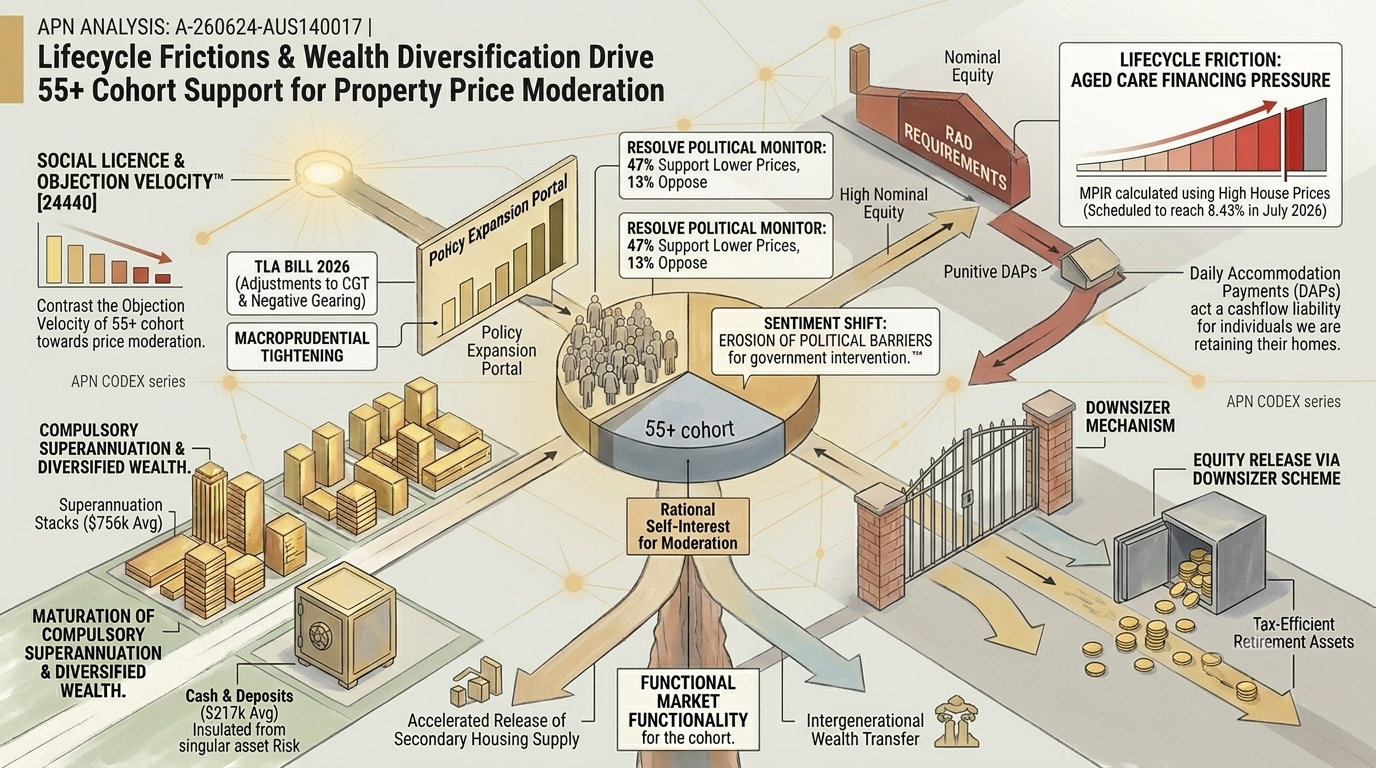
A structural shift in sentiment among Australia's 55+ demographic is recalibrating the political calculus of the residential property market. APN analysis identifies that this cohort's support for property price moderation is driven by rational, structural factors including wealth diversification through...
A federal tax reform aims to redirect investment capital into new housing supply by altering negative gearing and capital gains tax provisions. APN analysis identifies that structural constraints and elevated costs within the construction sector are likely to absorb this...
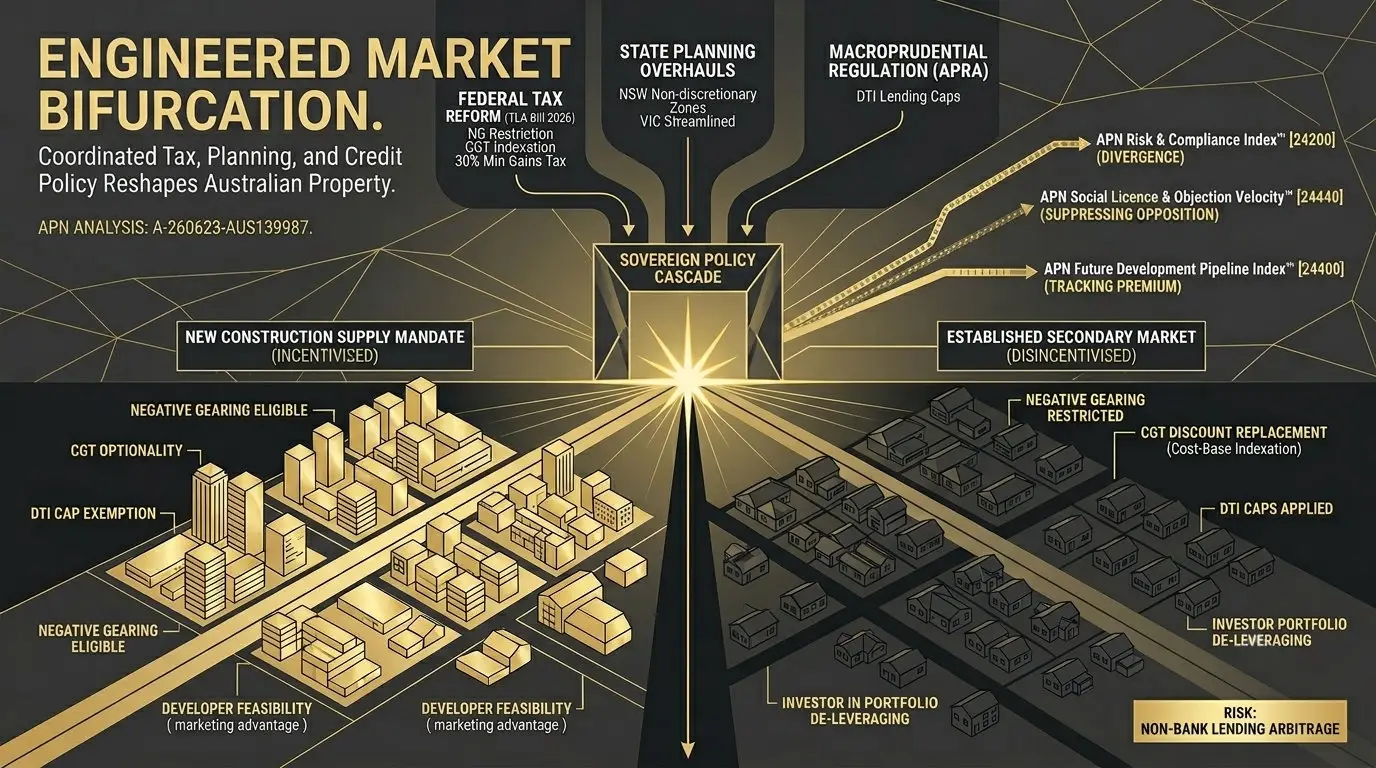
A coordinated regulatory cascade is fundamentally reshaping the Australian property market's risk and reward profile. APN analysis identifies how federal tax reform, state planning overhauls, and new credit limits are being systematically aligned to redirect capital from the established housing...
A structural dislocation between public sentiment and market outcomes is sustaining Australian residential price growth. APN analysis identifies that a physical housing supply deficit, persistent investor credit growth, and low secondary market listing volumes are mechanically overriding a widespread preference...
A majority of Australian property owners and investors now support lower residential property prices, a structural shift in public sentiment. APN analysis shows this consensus has neutralised the primary political barrier to sovereign interventions aimed at moderating the housing market,...
In six pieces, this series has examined a single proposition from six directions. The comparative evidence from Germany, New Zealand, Canada, Singapore, and South Korea adds the most important qualification: sequence is a binding variable — absorptive capacity must be...
The binding constraint on Australia's productive transition is physical and regulatory, not financial. Capital appetite exists. Absorptive capacity does not — at scale. Approximately 7 per cent of zoned industrial land in Greater Sydney is serviceable. Grid connections for large...
The flow of capital into data centres is the clearest proof that the productive yield thesis holds in practice. But data centres consume the same serviced industrial land and grid connection capacity that advanced manufacturing requires — continuously, at scale,...
The 2025 Founders Series argued that speculative property crowds out productive investment from domestic evidence. That argument now has external causal corroboration. The IMF's firm-level analysis of Canada documents the collateral channel: a protracted housing boom directs bank credit toward...
The effective yield advantage of productive industrial property over residential investment is structural, not cyclical — resting on net lease mechanics that deliver a clean income return well above what residential investment produces after frictional costs. The yield was always...
The data on Australia's capital transition contains an apparent contradiction. Foreign capital, superannuation, and listed markets are all moving toward productive assets. The residential mortgage book — $2.5 trillion, growing at 6.6 per cent — is not moving. Both readings...
The May 2026 Federal Budget has proposed the most significant restructuring of Australia's property investment incentive framework in a generation. But the reform answers only one half of the structural question. It addresses the architecture that directed capital toward residential...
APN assesses the structural evidence base underpinning One Nation's six-mechanism housing and population platform, identifies three mechanisms that work against the platform's stated objectives, and presents a reformed framework operating within the same policy agenda.
The 2026 Federal Budget exposed a structural failure in the Australian property information ecosystem — mainstream media amplified the alarm while the explanation never arrived.