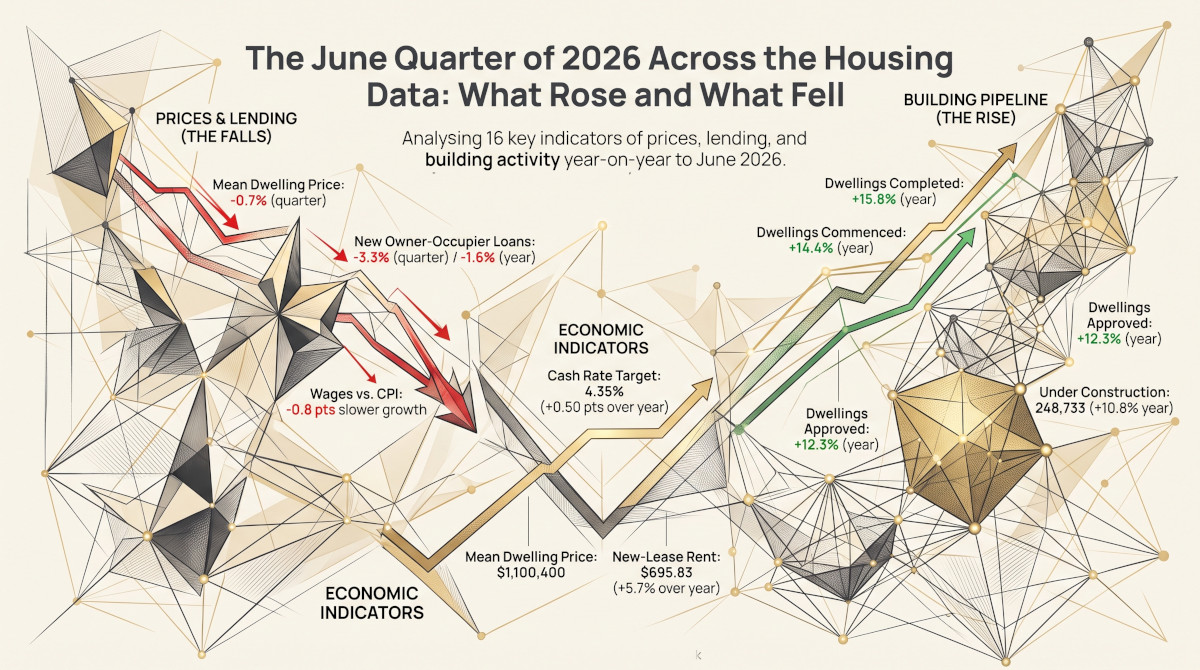

In the June quarter of 2026 prices and lending fell in the quarter while building ran well above a year earlier. The average dwelling value fell 0.7% in the quarter, the number of new owner-occupier loans fell 3.3%, and the investor share of new loans eased for a second quarter, while the cash rate ended June 0.75 percentage points above its level at the end of 2025. Compared with the June quarter of 2025, approvals rose 12.3%, commencements 14.4% and completions 15.8%, and 248,733 dwellings were under construction at the end of June, 10.8% more than a year earlier.
Each measure is compared with the June quarter of 2025. Sources and series are listed at the end.
How to read this article
This is a cross-section: sixteen published measures of the housing market and the conditions around it, each at the June quarter of 2026, or the latest available, and a year earlier. It does not combine them into a single score. Some are counted over the quarter (loans approved, dwellings commenced), some are levels at its end (the cash rate, dwellings under construction), and some are rates of growth over the year (consumer prices, wages). The building counts are not seasonally adjusted, so each is compared with the same quarter a year earlier and not with the March quarter.
| Measure | June quarter 2026 | June quarter 2025 | Change over the year |
|---|---|---|---|
| Prices and rents | |||
| Mean dwelling price | $1,100,400 | $1,029,900 | +6.8% |
| New-lease rent, five states, a week | $695.83 | $658.00 | +5.7% |
| New-lease rent as a share of full-time earnings | 33.4% | 32.7% | +0.7 pts |
| Incomes and costs | |||
| Consumer prices, growth over the year | 3.9% | 2.1% | +1.8 pts |
| Wages, growth over the year | 3.2% | 3.4% | −0.2 pts |
| Wage growth less consumer price growth | −0.8 pts | +1.3 pts | −2.1 pts |
| Economic output per person, growth over the year | +0.68% | +0.36% | +0.32 pts |
| Borrowing | |||
| Cash rate target, end of June | 4.35% | 3.85% | +0.50 pts |
| Average rate on existing owner-occupier variable loans, June | 6.25% | 5.79% | +0.46 pts |
| New owner-occupier loans in the quarter | 81,626 | 82,931 | −1.6% |
| Investor share of new home loans | 39.2% | 38.1% | +1.0 pts |
| Building | |||
| Dwellings approved in the quarter | 53,952 | 48,040 | +12.3% |
| Dwellings commenced in the quarter | 52,166 | 45,617 | +14.4% |
| Dwellings completed in the quarter | 47,654 | 41,153 | +15.8% |
| Dwellings under construction, end of quarter | 248,733 | 224,571 | +10.8% |
Loan counts, wages and output per person are seasonally adjusted; prices, consumer prices and the building counts are original, and are compared with the same quarter a year earlier. APN calculation based on Australian Bureau of Statistics data (Total Value of Dwellings; Consumer Price Index; Wage Price Index; Lending Indicators; Building Approvals, June 2026; Building Activity; Australian National Accounts, all June quarter 2026), Reserve Bank of Australia data (Statistical Tables F1 and F6) and bond lodgement data from five state bond authorities. Differences are calculated from unrounded figures.
Over the year: building up most, lending down
Change over the year to the June quarter 2026, by measure
Change between the June quarter 2025 and the June quarter 2026. APN calculation based on Australian Bureau of Statistics data (Total Value of Dwellings; Consumer Price Index; Wage Price Index; Lending Indicators; Building Approvals, June 2026; Building Activity; Australian National Accounts, all June quarter 2026), Reserve Bank of Australia data (Statistical Tables F1 and F6) and bond lodgement data from five state bond authorities.
Of the nine measures that can be expressed as a percentage change over the year, eight rose. The four building measures rose most, by between 10.8% and 15.8%. The mean dwelling price rose 6.8% and new-lease rents in the five states with bond data 5.7%; consumer prices rose 3.9% and wages 3.2%. The one fall was in the number of new owner-occupier loans, down 1.6%.
Prices and rents
Mean dwelling price, new-lease rent, consumer prices and wages, indexed
June quarter 2024 = 100. The rent measure covers New South Wales, Queensland, South Australia, Western Australia and Tasmania. APN calculation based on Australian Bureau of Statistics data (Total Value of Dwellings, Table 1, A83728647F; Consumer Price Index, A2325846C; Wage Price Index, A2713849C) and bond lodgement data from five state bond authorities.
The mean dwelling price, the ABS estimate of the average value of all dwellings, was $1,100,400 in the June quarter, down from $1,108,600 in March, which remains the highest in the series. Rents on new leases in the five states averaged $695.83 a week, 1.0% more than in March. Over two years both have outpaced consumer prices and wages. New-lease rent took 33.4% of full-time ordinary earnings, against 32.7% a year earlier and a little less than in March: the half-yearly earnings figure was updated in the June quarter, while rents themselves rose 1.0%. New-lease rents by state and dwelling prices against earnings are covered in separate articles.
Incomes and costs
Consumer prices rose 3.9% over the year to the June quarter, against 2.1% a year earlier. Wages, on the Wage Price Index, rose 3.2%, against 3.4%. A year ago wages were growing 1.3 percentage points faster than consumer prices; in the June quarter of 2026 they were growing 0.8 points slower. Economic output per person grew 0.68% over the year, less than in each of the two previous quarters and more than a year earlier.
Borrowing
The Reserve Bank’s cash rate target was 4.35% at the end of June 2026, against 3.60% at the end of 2025 and 3.85% a year earlier; it rose again, to 4.60%, on 30 September. The average rate paid on existing owner-occupier variable loans was 6.25% in June, 0.46 points higher than a year before. A separate article follows how cash-rate changes reach the rates borrowers pay.
Lenders approved 81,626 new loans to owner-occupiers in the quarter, the second quarterly fall from 87,659 in December. Investors accounted for 39.2% of new home loans, down from 40.8% in December and still 1.0 points above a year earlier. The investor share is examined in more detail elsewhere.
Building
Dwellings approved and dwellings commenced, by quarter
APN calculation based on Australian Bureau of Statistics data: Building Approvals, June 2026, Table 11 (A422064L), and Building Activity, June quarter 2026, Table 33 (A83801976T). Thousands of dwelling units in each quarter, original, June quarter 2024 to June quarter 2026; approvals are the sum of the three months. Both series have a seasonal pattern.
Every stage of the building pipeline was higher than a year earlier. 53,952 dwellings were approved in the quarter, 52,166 were commenced and 47,654 were completed. Because more were started than finished, the number under construction rose for a sixth consecutive quarter, to 248,733. The pipeline stage by stage and the time it would take to complete are covered in separate articles.
People
The population estimate runs a quarter behind the other measures. In the year to the March quarter of 2026 the population grew 1.43%, against 1.53% in the year to March 2025.
What this does not show
Sixteen measures side by side show what moved; they do not show what moved what. Building reflects decisions made many months earlier, so a higher count of homes under construction and a lower count of new loans can sit in the same quarter without contradiction. The rent measure covers five states and new leases only. The mean price is an estimate for all dwellings and its June figure may be revised, as may the building counts. One quarter’s fall in the mean price and two in lending do not establish a direction, and this article does not cover the months since June.
- Australian Bureau of Statistics (Reference period: June 2026) Australian National Accounts: National Income, Expenditure and Product [https://www.abs.gov.au/statistics/economy/national-accounts/australian-national-accounts-national-income-expenditure-and-product/jun-2026], ABS Website, accessed 10 October 2026.
- Australian Bureau of Statistics (Reference period: June 2026) Building Activity, Australia [https://www.abs.gov.au/statistics/industry/building-and-construction/building-activity-australia/jun-2026], ABS Website, accessed 10 October 2026.
- Australian Bureau of Statistics (Reference period: June 2026) Building Approvals, Australia [https://www.abs.gov.au/statistics/industry/building-and-construction/building-approvals-australia/jun-2026], ABS Website, accessed 10 October 2026.
- Australian Bureau of Statistics (Reference period: June 2026) Wage Price Index, Australia [https://www.abs.gov.au/statistics/economy/price-indexes-and-inflation/wage-price-index-australia/jun-2026], ABS Website, accessed 10 October 2026.
- Australian Bureau of Statistics (Reference period: June quarter 2026) Consumer Price Index, Australia [https://www.abs.gov.au/statistics/economy/price-indexes-and-inflation/consumer-price-index-australia/jun-2026], ABS Website, accessed 10 October 2026.
- Australian Bureau of Statistics (Reference period: June quarter 2026) Lending Indicators [https://www.abs.gov.au/statistics/economy/finance/lending-indicators/jun-quarter-2026], ABS Website, accessed 10 October 2026.
- Australian Bureau of Statistics (Reference period: June quarter 2026) Total Value of Dwellings, Australia [https://www.abs.gov.au/statistics/economy/price-indexes-and-inflation/total-value-dwellings/jun-quarter-2026], ABS Website, accessed 10 October 2026.
- Australian Bureau of Statistics (Reference period: March 2026) National, state and territory population [https://www.abs.gov.au/statistics/people/population/national-state-and-territory-population/mar-2026], ABS Website, accessed 10 October 2026.
- Australian Bureau of Statistics (Reference period: May 2026) Average Weekly Earnings, Australia [https://www.abs.gov.au/statistics/labour/earnings-and-working-conditions/average-weekly-earnings-australia/may-2026], ABS Website, accessed 11 October 2026.
- Consumer and Business Services (South Australia) Private rent report [https://data.sa.gov.au/data/dataset/private-rent-report], accessed 10 October 2026.
- Consumer Protection (Western Australia) Rental bonds data, 2023 to current [https://housing-data-exchange.ahdap.org/dataset/west-australia-rental-bonds-data-2023-current], accessed 10 October 2026.
- Consumer, Building and Occupational Services (Tasmania) Rental bond statistics [https://www.cbos.tas.gov.au/topics/housing/renting/bonds/rental-bond-statistics], accessed 10 October 2026.
- NSW Fair Trading Rental bond data: lodgements [https://www.nsw.gov.au/housing-and-construction/rental-forms-surveys-and-data/rental-bond-data], accessed 10 October 2026.
- Reserve Bank of Australia Statistical Tables F1 (Interest Rates and Yields, Money Market) and F6 (Housing Lending Rates) [https://www.rba.gov.au/statistics/tables/], accessed 10 October 2026.
- Residential Tenancies Authority (Queensland) Median rents quarterly data [https://www.rta.qld.gov.au/forms-resources/rta-quarterly-data/median-rents-quarterly-data], accessed 10 October 2026.
ABS material is used under a Creative Commons Attribution 4.0 International licence. Calculations, standardisations and index readings are APN’s and are not attributable to the ABS.
Reserve Bank of Australia material is used under a Creative Commons Attribution 4.0 International licence. The rent measure is calculated by APN from the state bond data named above and is not attributable to any publisher.
Findings are presented on the basis of data and evidence alone.