
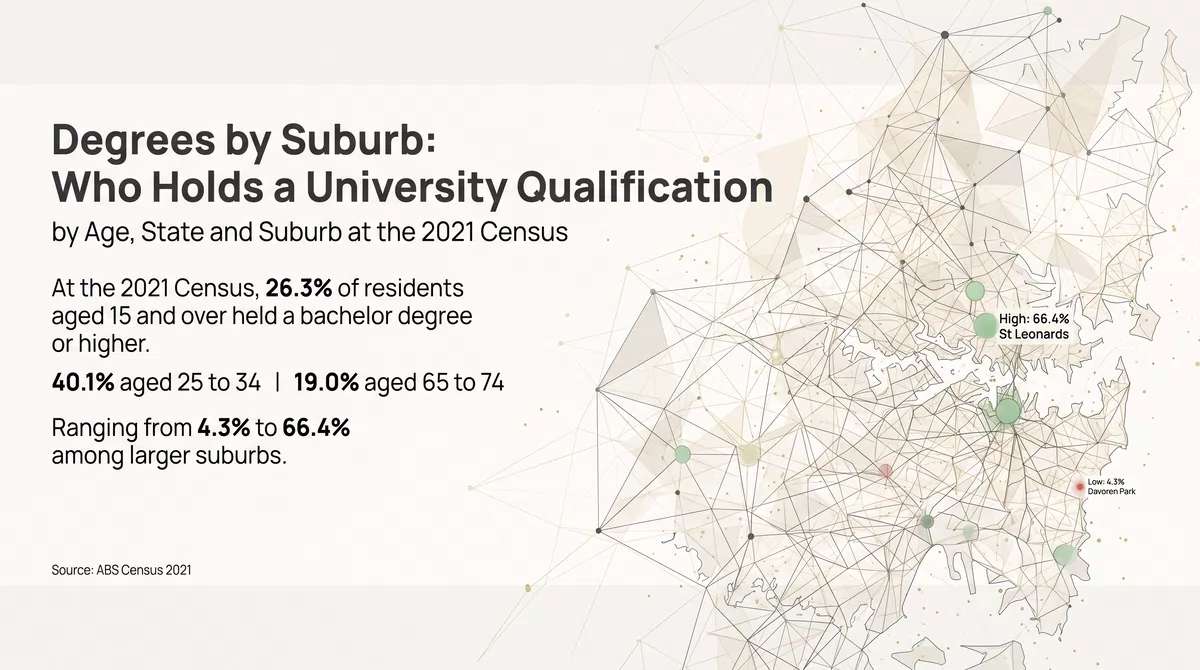

At the 2021 Census, 5.46 million people in Australia held a bachelor degree or a higher qualification: 26.3% of residents aged 15 and over. The share is 40.1% among people aged 25 to 34 and 19.0% among those aged 65 to 74. It rises with the size of the place, from 16.4% in localities of 201 to 999 residents to 29.5% in localities of 20,000 or more, while trade-level certificates run the other way. Among larger suburbs the degree share ranges from 4.3% to 66.4%.
Highest qualification is as stated at the Census of 10 August 2021.
What is measured
The Census asks each person aged 15 and over for the highest qualification they have completed since leaving school. Table G49 of the Census General Community Profile reports the answers by level. This article follows the ABS in counting three levels as a bachelor degree or above: postgraduate degrees (6.5% of residents aged 15 and over), graduate diplomas and graduate certificates (2.4%) and bachelor degrees (17.4%). For comparison, 9.4% held a diploma or advanced diploma as their highest qualification and 16.1% a Certificate III or IV, the level of most trade qualifications. Shares are of all residents aged 15 and over. For 7.8% of them the level was not stated, so every share here is somewhat understated.
By age
Share of each age group with a bachelor degree or above, Australia, 2021
APN calculation based on Australian Bureau of Statistics data: Census of Population and Housing: General Community Profile, 2021, Tables G01 (selected person characteristics) and G49 (highest non-school qualification: level of education by age by sex). Residents whose highest qualification is a bachelor degree or above, as a share of all residents in each age group, with the share of those degree holders who are women in brackets. Australia.
Four in ten people aged 25 to 44 hold a degree: 40.1% of those aged 25 to 34 and 40.0% of those aged 35 to 44. The share falls with each older group, to 19.0% at 65 to 74 and 7.2% at 85 and over. Women are 56.1% of all degree holders, and a majority in every age group under 75, reaching 58.6% at 25 to 34. The pattern reverses for trade-level qualifications: women are 35.0% of those whose highest qualification is a Certificate III or IV.
By state and territory
Share of residents aged 15 and over with a bachelor degree or above, by state and territory, 2021
APN calculation based on Australian Bureau of Statistics data: Census of Population and Housing: General Community Profile, 2021, Tables G01 (selected person characteristics) and G49 (highest non-school qualification: level of education by age by sex). Residents whose highest qualification is a bachelor degree or above, as a share of all residents aged 15 and over. The share whose highest qualification is a Certificate III or IV is shown in brackets.
The Australian Capital Territory is far ahead, at 42.9%, with 14.2% of its adult residents holding a postgraduate degree. Victoria (29.2%) and New South Wales (27.8%) follow, and the other five jurisdictions lie between 21.5% and 23.8%. Certificate III and IV qualifications are spread the other way: most common in Queensland, at 18.9%, and least common in the Australian Capital Territory, at 10.7%.
By size of place
Share of residents aged 15 and over with a bachelor degree or above, by the size of the locality
APN calculation based on Australian Bureau of Statistics data: Census of Population and Housing: General Community Profile, 2021, Tables G01 (selected person characteristics) and G49 (highest non-school qualification: level of education by age by sex). Residents whose highest qualification is a bachelor degree or above, as a share of all residents aged 15 and over. The share whose highest qualification is a Certificate III or IV is shown in brackets. Localities are ABS Suburbs and Localities, grouped by their number of residents.
The degree share rises with the size of the place and the Certificate III and IV share falls. In localities of 201 to 999 residents, 20.6% of adults hold a Certificate III or IV as their highest qualification and 16.4% a degree. In the 143 localities of 20,000 or more the order is reversed, at 13.3% and 29.5%. Taken together, localities with 200 or fewer residents, which are not reported individually, had a degree share of 13.5%.
How localities are spread
Number of localities by share of adult residents with a bachelor degree or above
APN calculation based on Australian Bureau of Statistics data: Census of Population and Housing: General Community Profile, 2021, Tables G01 (selected person characteristics) and G49 (highest non-school qualification: level of education by age by sex). The 6,951 localities with more than 200 residents, by the share of residents aged 15 and over with a bachelor degree or above, with the share of these localities’ adult residents living in each group.
Across the 6,951 localities with more than 200 residents, the middle locality had 17.0% of its adult residents holding a degree, well below the national 26.3%, because degree holders are concentrated in the larger places. In 255 localities at least half of adult residents hold a degree, and those localities are home to 8.0% of the adults living in these 6,951 localities. In 1,343 the share is under 10%, and those hold 8.4%.
The highest and lowest shares among larger suburbs
The lists below are limited to the 1,561 localities with at least 5,000 residents of all ages. In 130 of them at least half of adult residents hold a bachelor degree or above.
| Locality | State | Residents aged 15 and over | Bachelor degree or above | Certificate III or IV |
|---|---|---|---|---|
| St Leonards | NSW | 6,421 | 66.4% | 4.4% |
| Braddon | ACT | 6,047 | 64.9% | 5.1% |
| Wollstonecraft | NSW | 7,068 | 63.9% | 5.1% |
| Clifton Hill | Vic. | 5,554 | 62.9% | 5.5% |
| Carlton North | Vic. | 5,542 | 62.8% | 5.1% |
| Kingston | ACT | 6,016 | 62.7% | 5.0% |
| Erskineville | NSW | 8,614 | 62.4% | 6.0% |
| Rhodes | NSW | 10,052 | 62.0% | 3.9% |
| Paddington | NSW | 11,039 | 61.4% | 4.0% |
| Griffith | ACT | 4,630 | 60.7% | 5.6% |
The ten highest are inner suburbs of Sydney (five), Canberra (three) and Melbourne (two). In each, about six adult residents in ten hold a degree.
| Locality | State | Residents aged 15 and over | Bachelor degree or above | Certificate III or IV |
|---|---|---|---|---|
| Davoren Park | SA | 4,888 | 4.3% | 17.7% |
| Elizabeth Downs | SA | 4,008 | 4.6% | 18.8% |
| Whyalla Stuart | SA | 5,318 | 5.2% | 19.9% |
| Collie | WA | 6,211 | 5.3% | 25.1% |
| Logan Central | Qld | 4,751 | 5.6% | 15.2% |
| Sarina | Qld | 4,517 | 6.0% | 23.5% |
| Crestmead | Qld | 8,935 | 6.3% | 21.3% |
| Kingston | Qld | 8,138 | 6.6% | 18.0% |
| South Grafton | NSW | 4,949 | 6.8% | 21.3% |
| Cessnock | NSW | 13,509 | 6.8% | 21.0% |
APN calculation based on Australian Bureau of Statistics data: Census of Population and Housing: General Community Profile, 2021, Tables G01 (selected person characteristics) and G49 (highest non-school qualification: level of education by age by sex). Residents whose highest qualification is a bachelor degree or above, as a share of all residents aged 15 and over. Localities with at least 5,000 residents.
The ten lowest are outer suburbs of Adelaide and of Logan, south of Brisbane, and regional and industrial towns in four states. A low degree share is not a low level of qualification: in every one of the ten, the share of adults whose highest qualification is a Certificate III or IV is more than two and a half times the degree share.
Where this sits in the index
Human Capital Depth (24133) combines three measures for each locality: the share of adult residents with a bachelor or postgraduate degree, the share with a postgraduate degree, and the share of employed residents working as managers, professionals, technicians or trades workers. This article reports the first, on the ABS’s slightly wider definition, which also counts graduate diplomas and graduate certificates.
What this does not show
The figures show the highest qualification a person holds, not where they gained it, what it was in, or whether they use it in their work. They are strongly shaped by age: a suburb with many residents aged 25 to 44 tends to show a higher degree share than an older one. They count people where they lived in August 2021, so they reflect where graduates have moved to as much as where they grew up. Results from the August 2026 Census will update these figures.
- Australian Bureau of Statistics (Reference period: 2021) Census of Population and Housing: General Community Profile, tables G01 and G49, by Suburbs and Localities, state and Australia [https://www.abs.gov.au/census/find-census-data/datapacks], ABS Website, accessed 11 October 2026.
ABS material is used under a Creative Commons Attribution 4.0 International licence. Calculations, standardisations and index readings are APN’s and are not attributable to the ABS.
Disclaimer
The analysis and information contained in this publication are for general informational and strategic purposes only and do not constitute financial, investment, legal, or any other form of professional advice. Australian Property Network is not a licensed financial advisor. Property values and market conditions can go up or down. Before making any property or investment decisions, you must conduct your own thorough research and seek independent professional advice tailored to your specific circumstances. Images are for illustrative purposes only. E.&O.E.
Findings are presented on the basis of data and evidence alone.
