
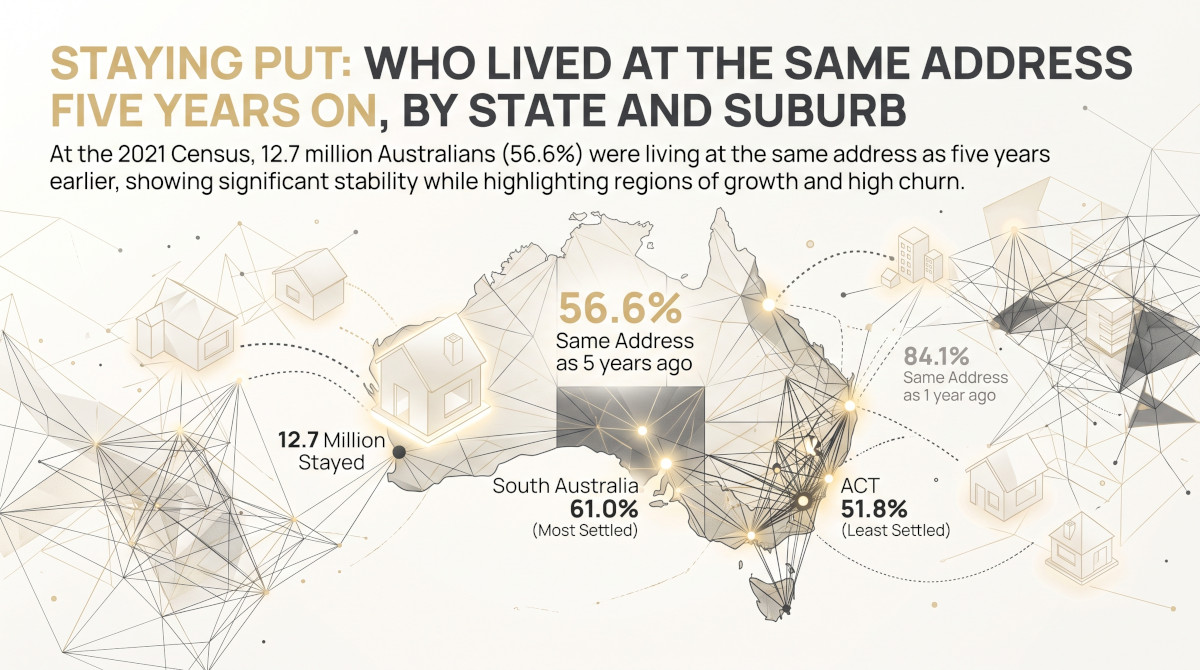

At the 2021 Census, 12.7 million Australians were living at the same address as five years earlier: 56.6% of those aged five and over who answered. The other 43.4% had moved, most of them from somewhere else in Australia and about one in eight of them from overseas. The share who had stayed put ran from 51.8% in the Australian Capital Territory to 61.0% in South Australia, and among larger suburbs from 3.2% to 81.9%.
The Census asked where each person usually lived one year and five years before 10 August 2021.
What the Census asked
The Census asks where each person usually lived one year ago and five years ago. Comparing those answers with the address on Census night, 10 August 2021, shows who had moved and who had not. The five-year question applies to people aged five and over, so the figures here leave out children under five; the one-year question applies to people aged one and over. About one person in sixteen did not answer, and the rates below are of those who did. On that basis 56.6% were at the same address as five years earlier; counted against everyone aged five and over, including those who did not answer, the figure is 53.1%.
Where people were living five years earlier
Where Australians lived five years before the 2021 Census
APN calculation based on Australian Bureau of Statistics data: Census of Population and Housing: General Community Profile, 2021, Table G45 (place of usual residence five years ago). Share of people aged five and over who answered the question. Australia. The local area is the ABS Statistical Area Level 2.
Of those who answered, 30.2% had moved from a different local area in Australia, 6.7% had moved within the same local area, and 5.7% had been living overseas. Over one year the picture is steadier: 84.1% were at the same address as twelve months before.
By state and territory
Share of people at the same address five years earlier, by state and territory, 2021
APN calculation based on Australian Bureau of Statistics data: Census of Population and Housing: General Community Profile, 2021, Tables G44 and G45 (place of usual residence one year and five years ago). Share of people who answered who lived at the same address five years earlier, with the share for one year earlier.
South Australia (61.0%) and Tasmania (60.1%) had the most settled populations, and Queensland (51.9%) and the Australian Capital Territory (51.8%) the least. The two largest states were close to the national figure. The Australian Capital Territory also had the highest share who had been overseas five years earlier, 7.3%, and Tasmania the lowest, 3.9%.
By size of place
Share of people at the same address five years earlier, by the size of the locality
APN calculation based on Australian Bureau of Statistics data: Census of Population and Housing: General Community Profile, 2021, Table G45 (place of usual residence five years ago). Share of people aged five and over who answered the question. Localities are ABS Suburbs and Localities, grouped by their number of people aged five and over.
Smaller places are more settled. In localities with 201 to 999 people aged five and over, 64.5% were at the same address as five years earlier; in the 126 localities with 20,000 or more, 54.0%. Taken together, the localities with 200 or fewer, which are not reported individually, had a rate of 69.3%.
How localities are spread
Number of localities by share of residents at the same address five years earlier
APN calculation based on Australian Bureau of Statistics data: Census of Population and Housing: General Community Profile, 2021, Table G45 (place of usual residence five years ago). The 6,829 localities with more than 200 people aged five and over, by the share at the same address five years earlier, with the share of residents living in each group.
Across the 6,829 localities with more than 200 people aged five and over, the middle locality had 62.8% of its residents at the same address as five years earlier. In 1,404 localities the share was 70% or more, though those places hold only 8.8% of residents. In 402 it was under 40%, and those hold 9.5%.
The most and least settled larger suburbs
The lists below are limited to the 1,480 localities with at least 5,000 people aged five and over.
| Locality | State | People aged five and over | At the same address five years earlier | Share of those who answered |
|---|---|---|---|---|
| Taylors Lakes | Vic. | 14,613 | 11,593 | 81.9% |
| Aspendale Gardens | Vic. | 6,140 | 4,758 | 79.4% |
| Cecil Hills | NSW | 6,627 | 4,958 | 77.1% |
| Keilor Downs | Vic. | 9,371 | 6,859 | 76.8% |
| Bonnyrigg Heights | NSW | 7,029 | 5,168 | 76.4% |
| Taylors Hill | Vic. | 14,535 | 10,715 | 76.2% |
| Lysterfield | Vic. | 6,398 | 4,759 | 76.0% |
| Keilor | Vic. | 5,637 | 4,147 | 76.0% |
| Cairnlea | Vic. | 9,537 | 7,005 | 75.8% |
| Eltham North | Vic. | 6,471 | 4,795 | 75.8% |
The ten most settled are established suburbs of Melbourne (eight) and Sydney (two), where three-quarters or more of residents had not moved in five years.
| Locality | State | People aged five and over | At the same address five years earlier | Share of those who answered |
|---|---|---|---|---|
| Spring Mountain | Qld | 5,364 | 166 | 3.2% |
| Aintree | Vic. | 6,953 | 408 | 6.1% |
| Box Hill | NSW | 5,684 | 350 | 6.3% |
| Marsden Park | NSW | 12,897 | 906 | 7.3% |
| Tallawong | NSW | 5,874 | 547 | 9.9% |
| Newstead | Qld | 7,310 | 780 | 11.7% |
| Clyde | Vic. | 9,737 | 1,331 | 14.3% |
| South Brisbane | Qld | 13,937 | 1,862 | 15.1% |
| Wolli Creek | NSW | 10,105 | 1,629 | 17.2% |
| Fortitude Valley | Qld | 9,501 | 1,515 | 17.5% |
APN calculation based on Australian Bureau of Statistics data: Census of Population and Housing: General Community Profile, 2021, Table G45 (place of usual residence five years ago). Share of people aged five and over who answered the question. Localities with at least 5,000 people aged five and over. Counts are as published by the ABS, which makes small random adjustments to protect confidentiality.
The least settled fall into two groups. Six are new estates on the edges of Sydney, Melbourne and Brisbane: Spring Mountain, Aintree, Box Hill, Marsden Park, Tallawong and Clyde. A suburb built within the previous five years cannot have many residents who lived there five years earlier, so a low figure there records growth, not turnover. The other four, Newstead, South Brisbane, Fortitude Valley and Wolli Creek, are inner-urban apartment districts.
Where this sits in the index
Housing Security & Churn (24124) ranks every locality on three measures from the 2021 Census: the share of residents at the same address one year earlier, the share at the same address five years earlier, and the share of homes that are owner-occupied. A locality’s reading is the average of its three national rankings. This article reports the second of the three.
What this does not show
The figures say who moved, not why. A move can be a choice or a necessity, and the Census does not distinguish them, so a low stability rate is not a measure of hardship. The five years to August 2021 include the period from March 2020 in which Australia’s international border was closed, which reduced arrivals from overseas. New suburbs show low rates because they are new. The figures are five years old; results from the August 2026 Census will show how the pattern has changed.
- Australian Bureau of Statistics (Reference period: 2021) Census of Population and Housing: General Community Profile, tables G44 and G45, by Suburbs and Localities, state and Australia [https://www.abs.gov.au/census/find-census-data/datapacks], ABS Website, accessed 10 October 2026.
ABS material is used under a Creative Commons Attribution 4.0 International licence. Calculations, standardisations and index readings are APN’s and are not attributable to the ABS.
Findings are presented on the basis of data and evidence alone.
