
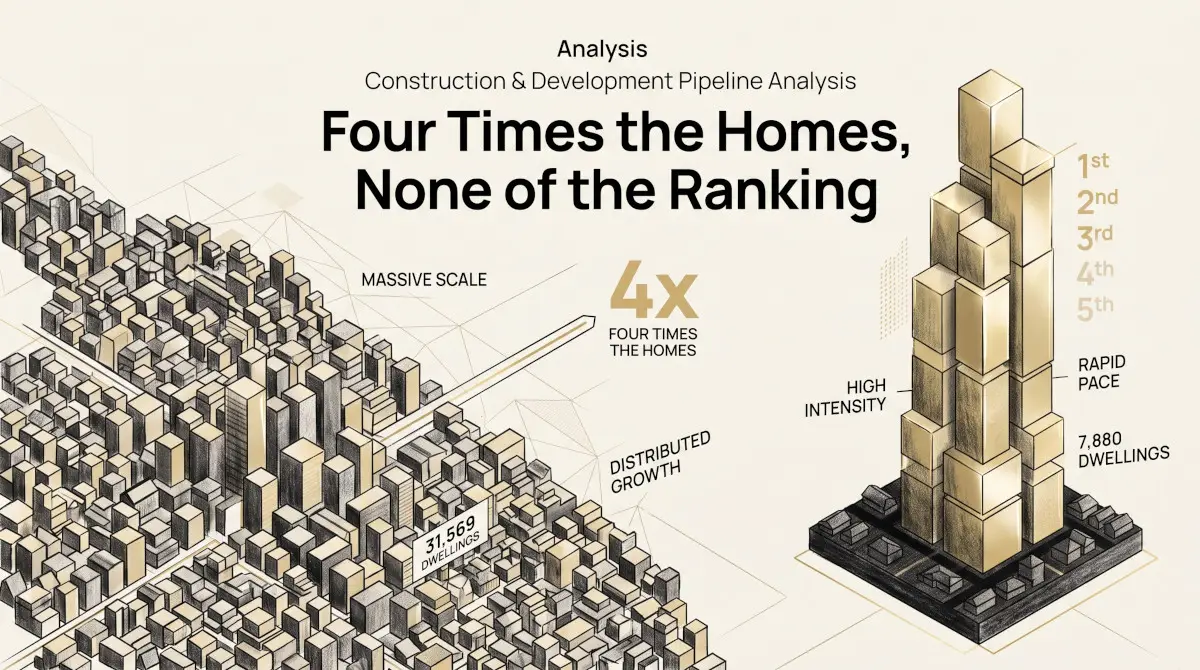

Queensland is the country’s second-fastest-building state on almost every measure that matters — approvals per resident, approvals per net new resident, four-year growth in total volume. Yet on a national leaderboard of the highest-intensity local government areas in the country, not one Queensland LGA appears. Western Australia holds five of the top ten spots. Queensland holds none. That’s not a contradiction. It’s two different shapes of the same boom, and the gap between them is worth four times as many actual homes.
Fifteen LGAs, one state
Build intensity — approvals over the trailing twelve months measured against a local government area’s existing housing stock — is a good way to see where construction activity is genuinely straining an area’s existing base, rather than simply where the most homes happen to be built in raw terms. The national top ten is dominated by Western Australia’s outer-Perth growth corridors, all comfortably clearing 4.7% of their existing stock in a single year.
Queensland’s best individual result doesn’t come close. Logan, the state’s highest-intensity LGA, sits at 4.23% — below the national top-ten cutoff. But Logan isn’t an outlier propping up an otherwise flat state. It’s the top of a long, remarkably consistent list.
Queensland’s own build-intensity leaderboard, trailing 12 months to June 2026
Intensity = trailing-12-month approved dwellings ÷ total private dwelling stock (2021 Census). Restricted to LGAs with a 2021 dwelling stock above 3,000. Brisbane itself sits further down this list, at 1.84%.
Twelve LGAs, every one of them between 2% and 4.3%. Widen the list further and it keeps going — Cairns, Toowoomba, Gympie, Brisbane itself. Nowhere does the state produce a single outlying reading. It produces a long, even spread of solid ones.
Five LGAs, a different state
Western Australia’s national leaderboard entries look nothing like this. Five LGAs — Serpentine-Jarrahdale, Kwinana, Wanneroo, Augusta Margaret River and Armadale — account for the state’s entire presence at the top of the national table, each clearing 4.7% or more.
| WA LGA | Dwellings approved (12mo) | Existing stock (2021) | Intensity |
|---|---|---|---|
| Serpentine-Jarrahdale | 760 | 10,883 | 6.98% |
| Kwinana | 1,052 | 16,910 | 6.22% |
| Wanneroo | 4,018 | 75,811 | 5.30% |
| Augusta Margaret River | 403 | 8,121 | 4.96% |
| Armadale | 1,647 | 34,874 | 4.72% |
Same source and construction as the Queensland table above.
Every one of these is a small, outer-fringe satellite LGA. The largest, Wanneroo, has an existing base of 75,811 dwellings — smaller than any of Queensland’s top five by volume. The smallest, Augusta Margaret River, has just 8,121.
The same growth, a wildly different ratio
Add up each state’s five leading LGAs and the picture inverts completely. Western Australia’s five approved 7,880 dwellings against a combined existing base of 146,599 — a combined intensity of 5.4%, comfortably a national-leading number. Queensland’s five largest contributors — Brisbane, Gold Coast, Moreton Bay, Logan and Ipswich — approved 31,569 dwellings, against a combined base of 1,140,986, for a combined intensity of just 2.8%.
Queensland’s leading LGAs approved almost exactly four times as many dwellings as Western Australia’s did — and rank nowhere on the national intensity table, because Brisbane, Gold Coast and Moreton Bay were already large, mature metropolitan areas before this building cycle started. The same volume of new construction lands as a rounding error against a base of half a million dwellings, and as a headline-grabbing ratio against a base of eleven thousand.
Two shapes, not one winner
Neither shape is the “real” boom and the other a statistical illusion. Western Australia’s growth corridors are genuinely transforming fast, in percentage terms, on a small existing footprint — that’s real information about pace of change, and about the strain new supply places on local services, roads and schools built for a much smaller population. Queensland’s growth is genuinely larger in absolute terms, spread across a state that was already home to more people and more housing — that’s real information about scale, and about where the largest number of actual new residents will end up living.
What a build-intensity leaderboard measures well is concentration. What it measures poorly, by construction, is scale. A state can rank nowhere on the first while comfortably leading the country on the second — and Queensland, over the twelve months to June 2026, did exactly that.
Findings are presented on the basis of data and evidence alone.


