
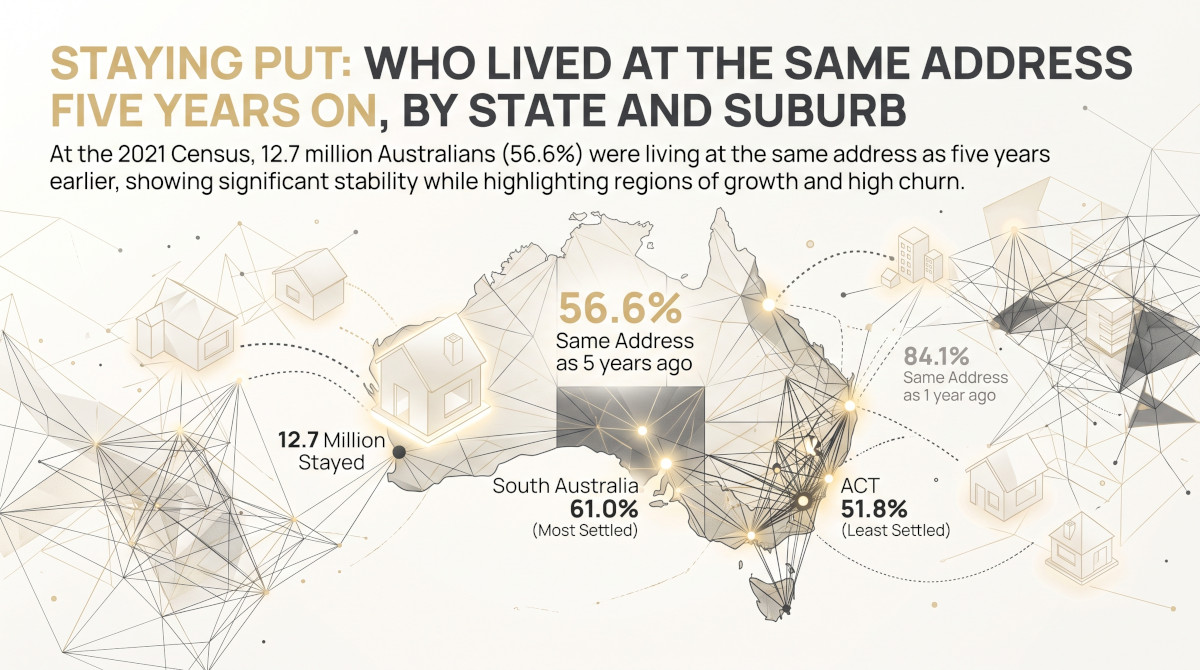

Staying Put: Who Lived at the Same Address Five Years On, by State and Suburb
At the 2021 Census 12.7 million Australians were at the same address as five years earlier, 56.6% of those who answered. South Australia was the most settled state at 61.0%; among larger suburbs the share ran from 3.2% in a...
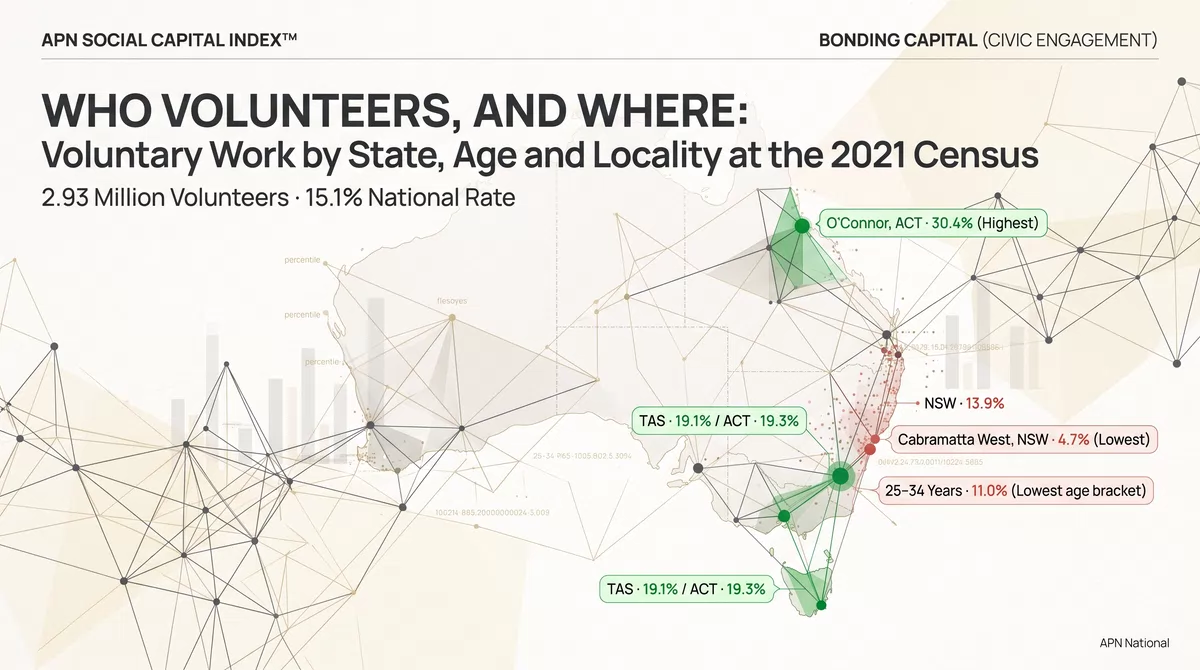
Who Volunteers, and Where: Voluntary Work by State, Age and Locality at the 2021 Census
At the 2021 Census 2,933,646 Australians had volunteered in the previous year: 14.1% of people aged 15 and over, or 15.1% of those who answered the question. Among those who answered, the rate was 20.0% in localities with 201 to...
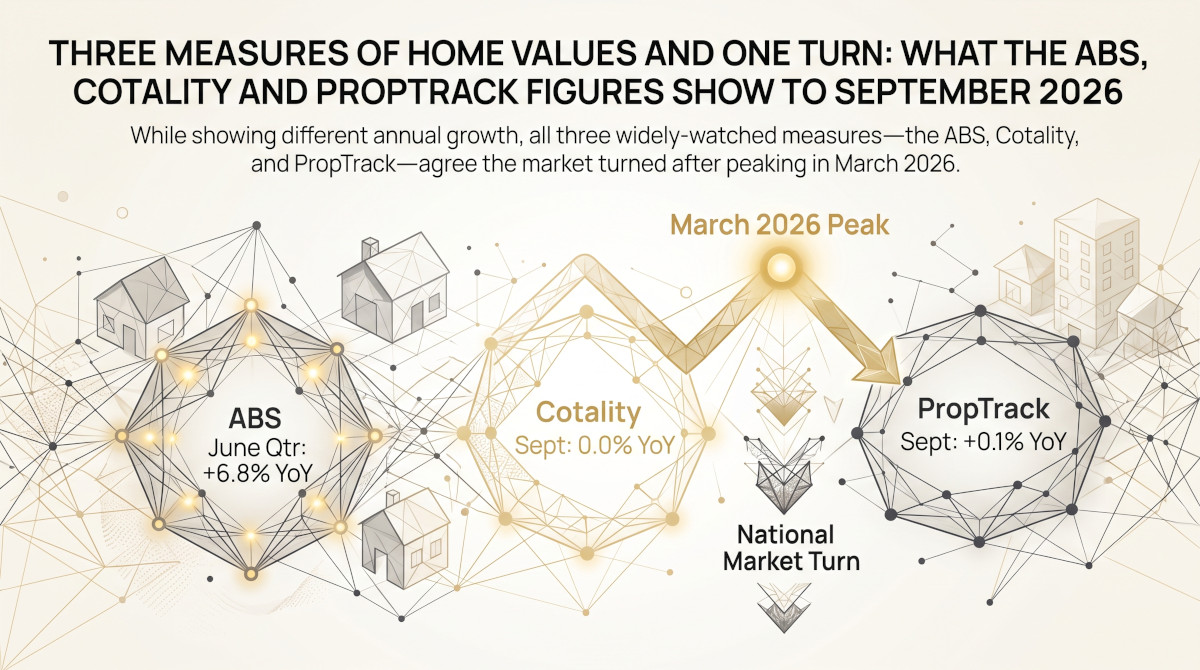
Three Measures of Home Values and One Turn: What the ABS, Cotality and PropTrack Figures Show to September 2026
Annual growth in home values reads 6.8%, 0.0% or 0.1% depending on the measure. The ABS figure is for the June quarter and the Cotality and PropTrack figures for September; all three put the high point in March 2026 and...
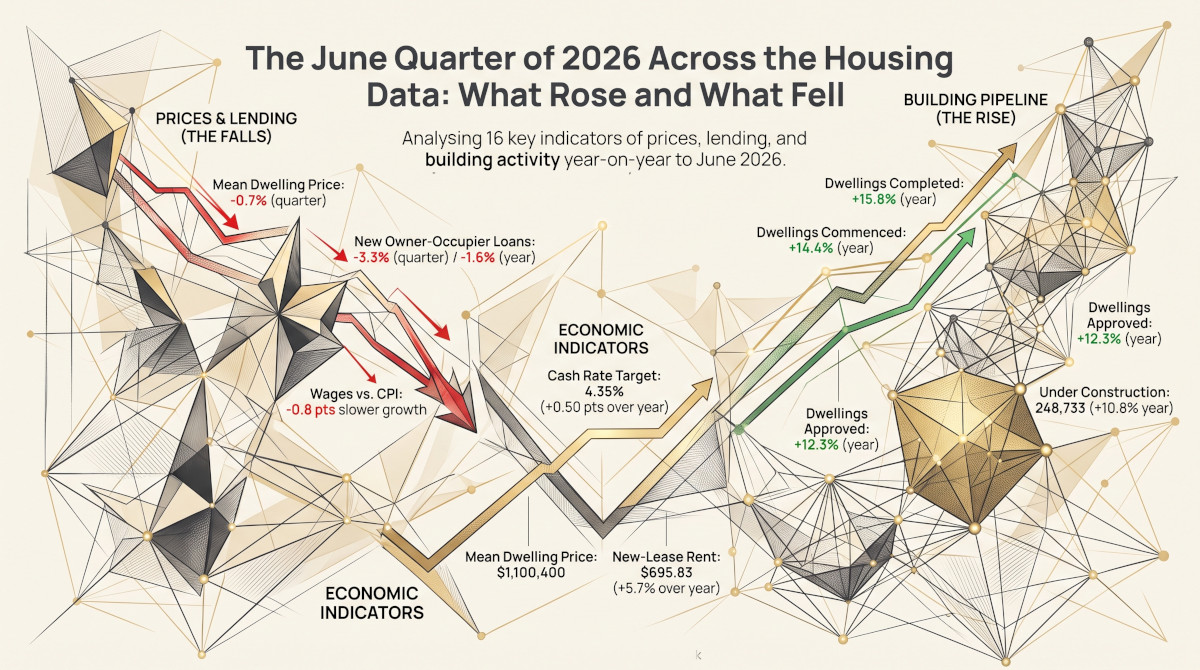
The June Quarter of 2026 Across the Housing Data: What Rose and What Fell
In the June quarter of 2026 the mean dwelling price fell 0.7% and new owner-occupier loans 3.3%, while approvals, commencements and completions were each more than 12% above a year earlier and 248,733 dwellings were under construction. Sixteen measures side...
Where Investors Borrow: The Investor Share of New Home Loans, State by State
Investors took out 40.3% of new home loans in the year to June 2026, up from 27.4% six years earlier. The share runs from 48.3% in the Northern Territory to 28.2% in the ACT, and Western Australia's has more than...
Rising Together: How Often Dwelling Prices and Home Loan Numbers Move in the Same Direction
Through 2025 the mean dwelling price and the number of new home loans rose together for four quarters, the longest run since 2011. In the June quarter of 2026 both fell, for the first time since March 2023. Across 59...
