Australia’s total fertility rate was 1.481 babies per woman in 2024, the lowest since at least 1975 and down from 1.917 in 2011. The fall is concentrated among women under 35.
Between 2011 and 2026 the number of Australians aged 75 to 79 rose 86% while children under five rose 3.2%. The median age went from 37.2 to 38.5 and the most common single age from 39 to 31.
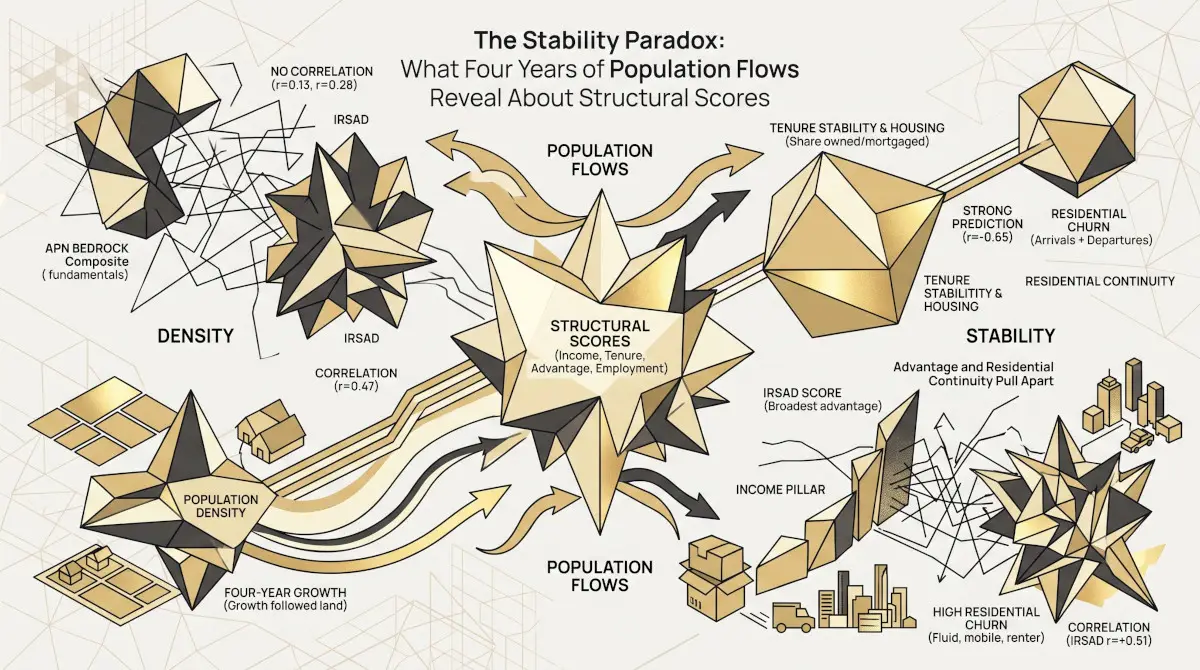
Structural scores measured in 2021 predicted essentially nothing about where Australia's population grew over the following four years — density did. But residential stability was predictable, by one measure: tenure structure anticipated four years of churn at r = −0.54....
A pre-registered "downsizing dead end" hypothesis failed twice: the age–building relationship is weak and bends upward in the oldest LGAs, and 55% of over-65s live in the highest-building metro quintiles. If a dead end exists, it's product mix — not...
Outright home ownership tracks age almost perfectly across Australia's LGAs (+0.884) and tracks income negatively (−0.489). Mining boomtowns and harbour suburbs share the same high incomes but sit at opposite ends of the ownership scale — the real driver is...
Population growth tracks building approvals closely across 546 LGAs (r = 0.952) — but Western Australia absorbs growth at 4.63 persons per approval, nearly double Victoria and NSW. Splitting population growth by migration source reveals why: inner and middle-ring Perth...
Population growth and building approvals correlate strongly across 70 LGAs (r = 0.84) — but 24 LGAs depart from that pattern by 1.75 dwellings per 1,000 residents or more. Eleven established, mostly high-advantage suburbs under-build relative to their own growth;...
Almost two million taxable individuals live in one of 83 LGAs where a decade of nominal income growth becomes flat-to-negative once inflation is applied. An APN LGA Intelligence analysis of a decade of ATO taxation data, CPI-deflated, across all 531...
Sydney's median taxable income grew 51.5% nominally over the decade to 2023-24 - 16.3% in real terms. Melbourne's grew 16.2% nominally, a 10.9% real-terms decline. An APN LGA Intelligence analysis of a decade of ATO taxation data, CPI-deflated, across Australia's...
Brisbane (1.375M people) and Knox (163,820) sit within 1.5 points of each other on APN Bedrock composite — 55.86 and 54.38. Across the 50 most populous LGAs, population size explains less than 0.1 per cent of the variance in Bedrock...
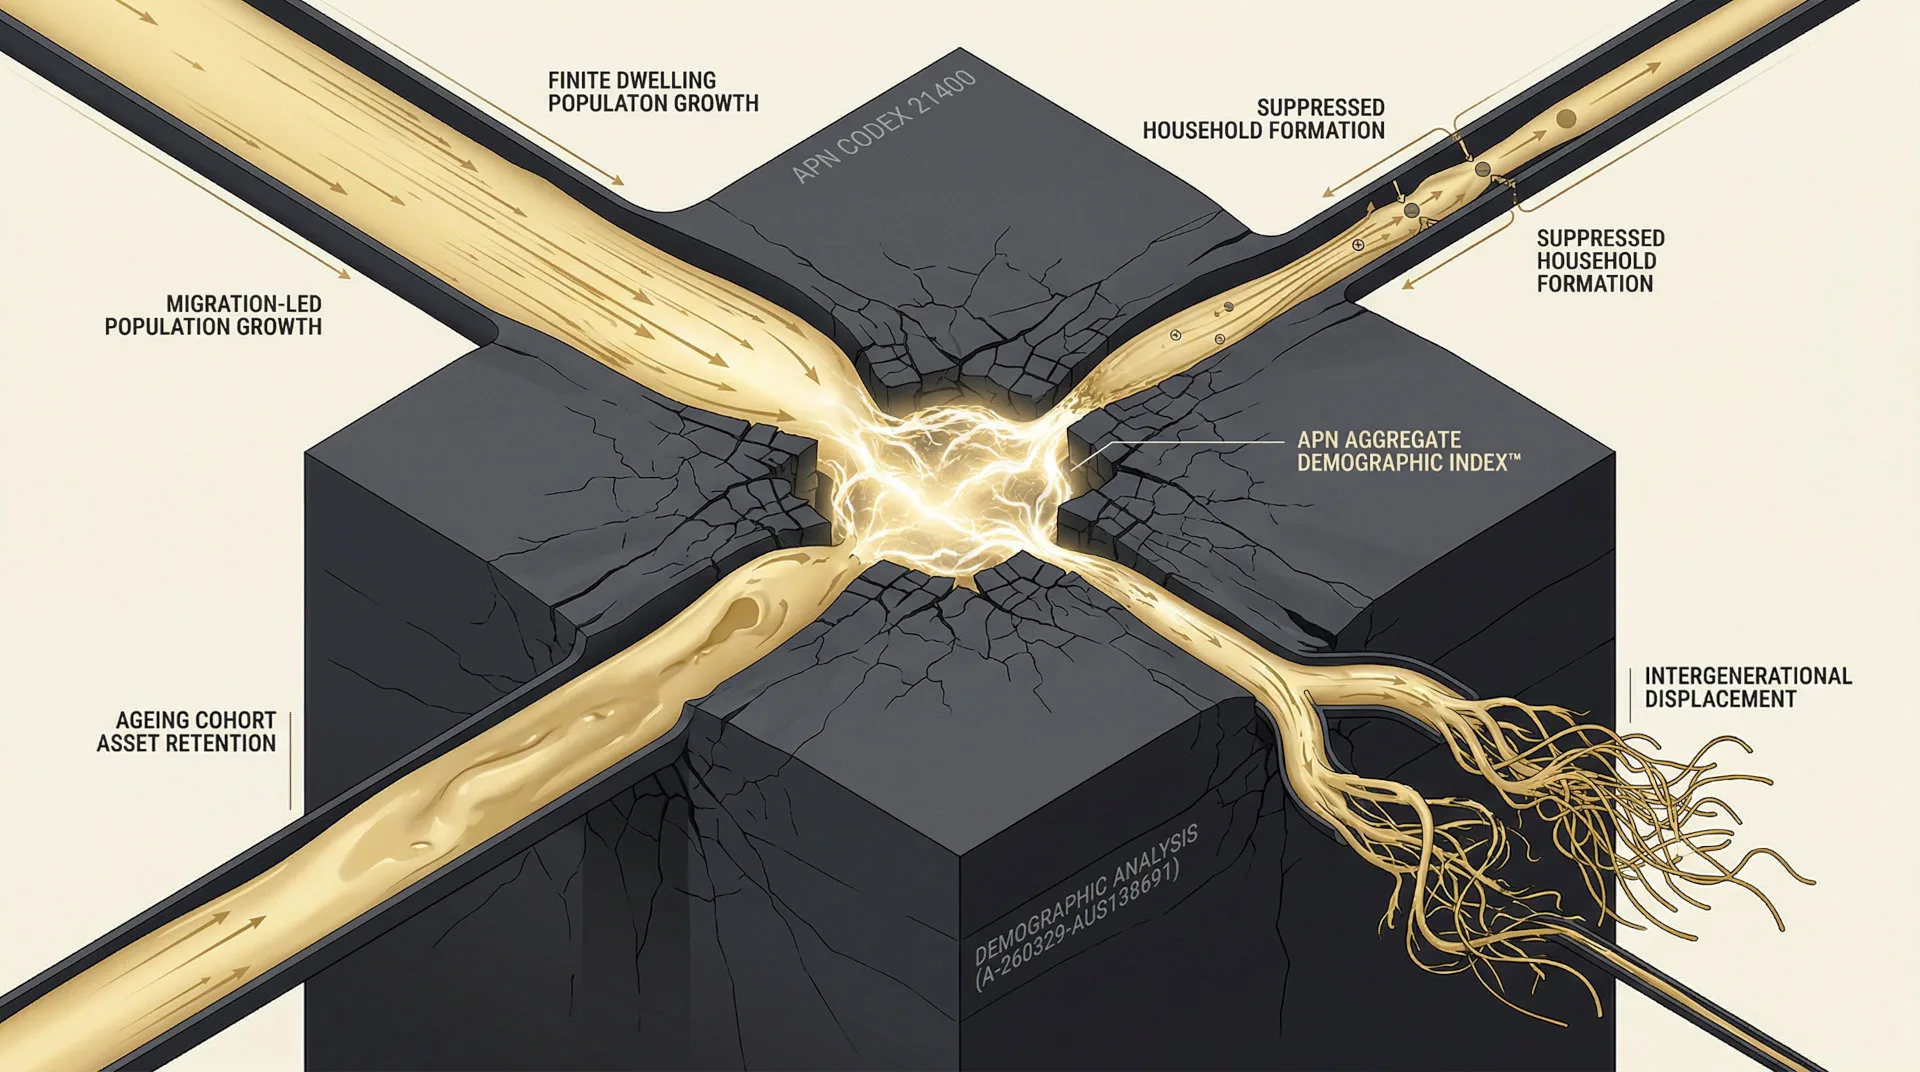
Compound demographic pressures are creating a structural constraint on the Australian housing market, limiting access for non-incumbent cohorts. APN analysis identifies that a combination of high migration-led population growth, significant asset retention by a debt-free senior cohort, and suppressed household...
This analysis, based on McCrindle Research data originally published on Morningstar Australia, examines intergenerational housing affordability in Australia, revealing a stark contrast between Baby Boomers and Generation Z. In 1980, a Sydney house cost Baby Boomers 5.1 times their annual...