
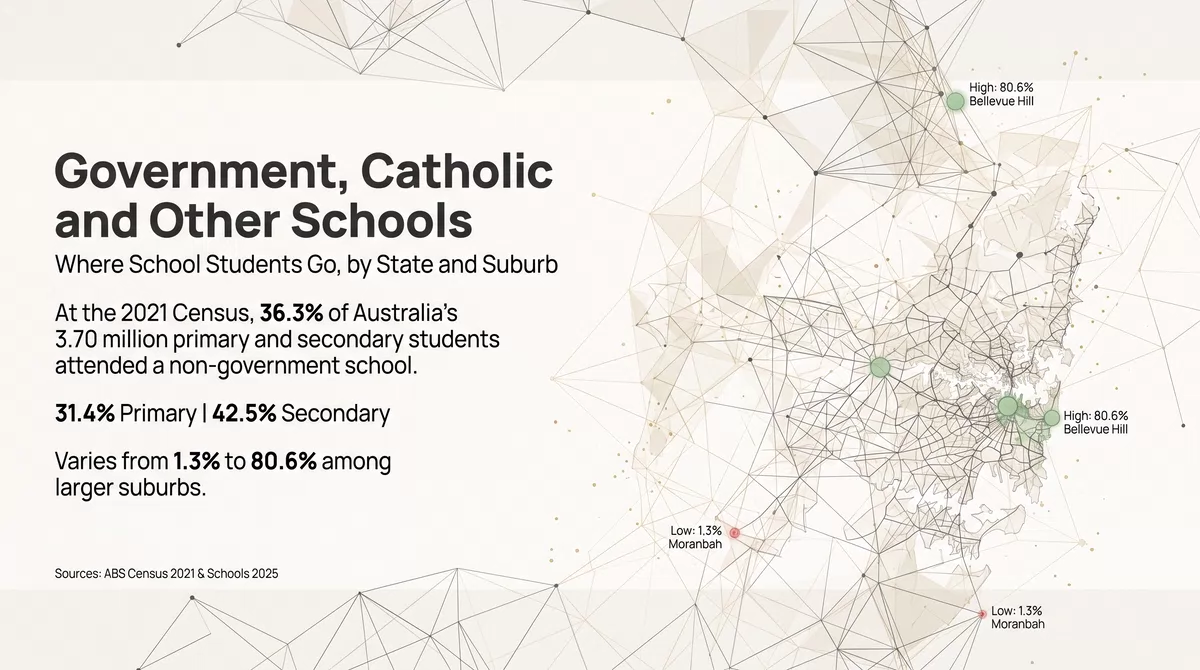

At the 2021 Census, 36.3% of Australia’s 3.70 million primary and secondary students attended a non-government school: 20.7% a Catholic school and 15.6% another non-government school. The share is 31.4% in primary school and 42.5% in secondary school. Between the states it varies little, from 33.2% in Tasmania to 37.9% in South Australia. Between suburbs it varies a great deal: among larger suburbs, from 1.3% to 80.6%.
Students are counted where they live, not where their school is.
What is measured
The Census asks what type of educational institution each person attends, and for school students whether it is a government, Catholic or other non-government school. The figures here come from table G15 of the Census General Community Profile and cover primary and secondary students together. Each student is counted in the suburb where they live. A suburb’s figure therefore describes the choices of the families who live there, not the schools located there: many students travel to a school in another suburb.
By state and territory
Share of school students attending a non-government school, by state and territory, 2021
APN calculation based on Australian Bureau of Statistics data: Census of Population and Housing: General Community Profile, 2021, Table G15 (type of educational institution attending). Share of primary and secondary students attending a Catholic or other non-government school, by where the student lives. The shares for Catholic and for other non-government schools are shown in brackets.
Six of the eight jurisdictions sit within three percentage points of each other, between 35.0% and 37.9%. Tasmania (33.2%) and the Northern Territory (27.9%) are lower. The make-up differs more than the total: the Catholic share is highest in the Australian Capital Territory, at 23.9%, and the share in other non-government schools is highest in South Australia, at 18.5%.
How many schools there are
The ABS Schools collection counts schools, not students, and its latest edition is for 2025. It records 9,673 schools in Australia: 6,737 government, 1,758 Catholic and 1,178 independent.
| State or territory | Government | Catholic | Independent | All schools | Non-government share |
|---|---|---|---|---|---|
| New South Wales | 2,158 | 597 | 384 | 3,139 | 31.3% |
| Victoria | 1,573 | 494 | 228 | 2,295 | 31.5% |
| Queensland | 1,252 | 314 | 237 | 1,803 | 30.6% |
| South Australia | 508 | 101 | 105 | 714 | 28.9% |
| Western Australia | 813 | 164 | 149 | 1,126 | 27.8% |
| Tasmania | 191 | 38 | 34 | 263 | 27.4% |
| Northern Territory | 150 | 18 | 26 | 194 | 22.7% |
| Australian Capital Territory | 92 | 32 | 15 | 139 | 33.8% |
| Australia | 6,737 | 1,758 | 1,178 | 9,673 | 30.4% |
APN calculation based on Australian Bureau of Statistics data: Schools, 2025, Table 35b (count of all schools). Number of schools by affiliation, with APN’s calculation of the non-government share.
Non-government schools are 30.4% of all schools, a smaller share than their 36.3% of students at the 2021 Census. The two figures are four years apart and count different things, so they are not directly comparable, but both put the non-government sector at roughly a third of schooling.
By size of place
Share of school students attending a non-government school, by the number of school students in the locality
APN calculation based on Australian Bureau of Statistics data: Census of Population and Housing: General Community Profile, 2021, Table G15 (type of educational institution attending). Share of primary and secondary students attending a Catholic or other non-government school, by where the student lives. Localities are ABS Suburbs and Localities, grouped by their number of school students.
The size of a place makes little difference. In localities with 200 to 999 school students the share was 36.8%, and in the 156 localities with 3,000 or more it was 35.0%. Only the smallest places differ: taken together, localities with fewer than 50 school students had 29.0% in non-government schools.
How localities are spread
Number of localities by share of school students attending a non-government school
APN calculation based on Australian Bureau of Statistics data: Census of Population and Housing: General Community Profile, 2021, Table G15 (type of educational institution attending). The 4,451 localities with at least 100 school students, by the share attending a non-government school, with the share of school students living in each group.
Across the 4,451 localities with at least 100 school students, the middle locality had 35.1% of them in non-government schools. About 79% of school students live in localities where the share is between 20% and 50%. In 790 localities at least half attend a non-government school, and those localities hold 14.3% of school students. In 141 localities the share is under 10%.
The highest and lowest shares among larger suburbs
The lists below are limited to the 611 localities with at least 1,500 school students. In 77 of them, at least half of school students attend a non-government school.
| Locality | State | School students | Catholic schools | Other non-government schools | All non-government schools |
|---|---|---|---|---|---|
| Bellevue Hill | NSW | 1,702 | 10.3% | 70.2% | 80.6% |
| Caulfield North | Vic. | 2,216 | 7.6% | 68.7% | 76.3% |
| Vaucluse | NSW | 1,756 | 14.3% | 60.5% | 74.8% |
| St Kilda East | Vic. | 1,550 | 8.3% | 64.0% | 72.3% |
| Brighton | Vic. | 3,536 | 18.3% | 53.6% | 71.9% |
| Elsternwick | Vic. | 1,585 | 20.2% | 50.9% | 71.1% |
| Newtown | Vic. | 1,845 | 35.5% | 33.7% | 69.2% |
| Hunters Hill | NSW | 1,650 | 41.5% | 27.0% | 68.5% |
| Kew | Vic. | 3,802 | 22.2% | 45.0% | 67.1% |
| Hope Island | Qld | 1,627 | 19.1% | 47.4% | 66.5% |
Six of the ten highest are in Victoria, five of them in Melbourne’s inner south-east and east and one in Geelong; three are in Sydney and one, Hope Island, is on the Gold Coast. In eight of the ten, other non-government schools account for more students than Catholic schools do, the reverse of the national pattern.
| Locality | State | School students | Catholic schools | Other non-government schools | All non-government schools |
|---|---|---|---|---|---|
| Moranbah | Qld | 1,668 | 0.4% | 0.9% | 1.3% |
| Willetton | WA | 4,411 | 3.7% | 3.5% | 7.2% |
| South Hedland | WA | 1,748 | 5.1% | 2.7% | 7.8% |
| Broken Hill | NSW | 2,175 | 7.1% | 1.1% | 8.2% |
| West End | Qld | 1,622 | 6.0% | 6.7% | 12.6% |
| Cabramatta | NSW | 2,832 | 11.3% | 2.3% | 13.6% |
| Canley Heights | NSW | 1,919 | 13.0% | 1.8% | 14.8% |
| Macquarie Fields | NSW | 2,492 | 5.7% | 9.1% | 14.8% |
| Westmead | NSW | 2,292 | 10.7% | 4.2% | 14.9% |
| Parramatta | NSW | 2,861 | 10.1% | 5.0% | 15.1% |
APN calculation based on Australian Bureau of Statistics data: Census of Population and Housing: General Community Profile, 2021, Table G15 (type of educational institution attending). Share of primary and secondary students attending a Catholic or other non-government school, by where the student lives. Localities with at least 1,500 school students. Counts are as published by the ABS, which makes small random adjustments to protect confidentiality.
The ten lowest include the mining and regional towns of Moranbah, South Hedland and Broken Hill, and suburbs of Perth, Brisbane and western and south-western Sydney. In each, at least 84% of school students attend a government school.
What this does not show
The figures say which kind of school students attend, not why. They carry no information about school quality or results, fees, the distance to the nearest school of each kind, or whether a family had a choice. A low non-government share can reflect preference for the local government school as readily as the absence of an alternative. The Census figures are for August 2021; results from the August 2026 Census will update them. The count of schools is for 2025.
- Australian Bureau of Statistics (Reference period: 2021) Census of Population and Housing: General Community Profile, table G15, by Suburbs and Localities, state and Australia [https://www.abs.gov.au/census/find-census-data/datapacks], ABS Website, accessed 11 October 2026.
- Australian Bureau of Statistics (Reference period: 2025) ‘Table 35b: Count of all schools, 2010-2025’ [data set], Schools [https://www.abs.gov.au/statistics/people/education/schools/latest-release], accessed 11 October 2026.
ABS material is used under a Creative Commons Attribution 4.0 International licence. Calculations, standardisations and index readings are APN’s and are not attributable to the ABS.
Disclaimer
The analysis and information contained in this publication are for general informational and strategic purposes only and do not constitute financial, investment, legal, or any other form of professional advice. Australian Property Network is not a licensed financial advisor. Property values and market conditions can go up or down. Before making any property or investment decisions, you must conduct your own thorough research and seek independent professional advice tailored to your specific circumstances. Images are for illustrative purposes only. E.&O.E.
Findings are presented on the basis of data and evidence alone.
