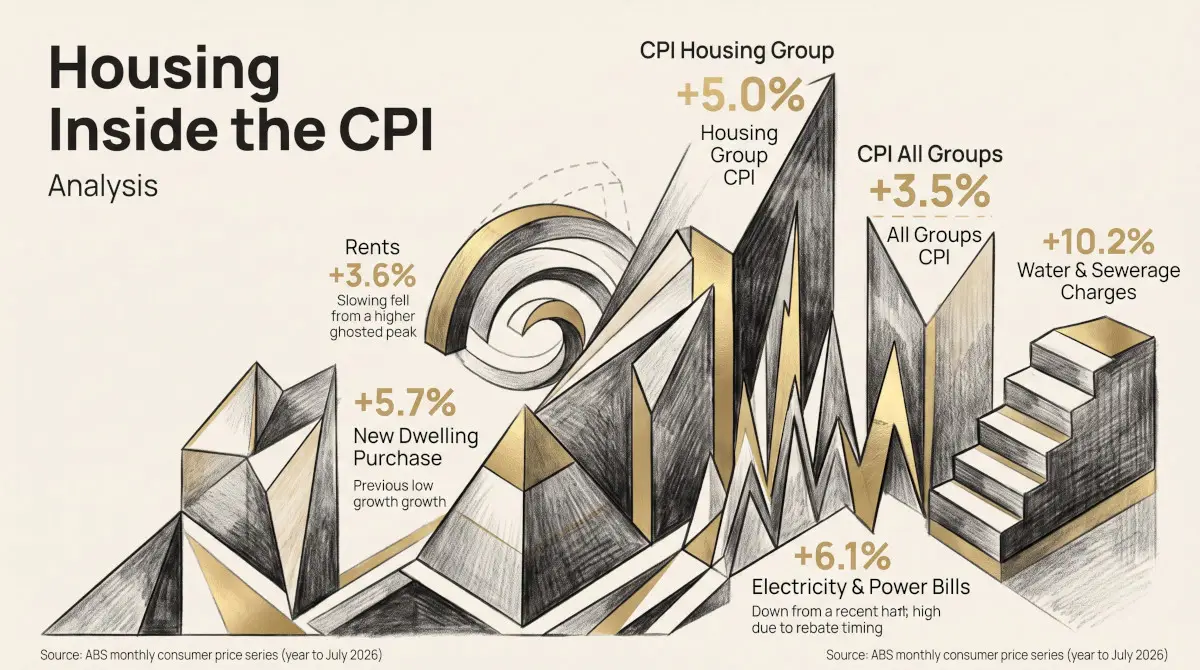
Australia’s Consumer Price Index rose 3.5% in the twelve months to July 2026, down from 3.8% in June — on its face, a clear cooling. But the Trimmed Mean, the Reserve Bank’s preferred underlying-inflation gauge, held at 3.6%, unchanged from June and now above the headline figure for the first time in this cycle. That gap matters more than the headline drop: it means the improvement is concentrated in a handful of volatile items, not spread across the basket. And within the basket, Housing remains the single largest contributor to annual inflation — still running at 5.0%, with one housing sub-component accelerating faster than any other component APN tracks.
What the Trimmed Mean actually strips out
Headline CPI averages the price change of everything in the household spending basket, which means a handful of outsized movements — a fuel price spike, an airfare crash — can swing the whole number even if most prices barely moved. The Trimmed Mean is the ABS’s fix for that: each month, it removes the items with the largest price falls and the largest price rises (the most volatile 15% at each end) and averages what’s left. That makes it a cleaner read on persistent inflation pressure, which is exactly why the RBA leans on it more than the headline number when setting rates. When headline falls but trimmed mean doesn’t, as happened this month, the honest reading is that underlying inflation hasn’t actually eased — the volatile components did.
All-Groups CPI vs Trimmed Mean, Annual % Change, Aug 2025 – Jul 2026
Source: ABS 6401.0 Consumer Price Index, Australia, monthly indicator, All Groups (Original) and Trimmed Mean (Seasonally Adjusted), annual % change. March 2026’s 4.6% headline spike has fully unwound; the Trimmed Mean line has instead climbed steadily and has not turned down.
Housing is still doing most of the work
Of the eleven CPI groups, Housing contributed the most to the annual result — up 5.0% for the year, well ahead of Food and Non-Alcoholic Beverages (+3.2%) and Recreation and Culture (+2.6%), the next-largest contributors. Housing is a big enough slice of the average household budget that it can move the headline number on its own even when most other prices are behaving. The ABS breaks Housing down into several sub-groups — rents, new dwelling purchase costs for owner-occupiers, other housing charges, property rates, and utilities (electricity, gas, water and sewerage) — each priced from a fixed sample of properties and providers every month. Looking at how those sub-groups have moved over just the last six months shows the story isn’t uniform.
Housing & Utility Sub-Components, 6-Month Index Change, Jan–Jul 2026
Source: ABS 6401.0 Table 3, CPI Group/Sub-group/Expenditure Class, Weighted Average of Eight Capital Cities, Original index numbers, January to July 2026. Red bar (Water & Sewerage) is an annual local-government rate-setting reset, not a monthly trend — the index was flat from March to June before stepping up in July. Grey bars are essentially flat or noisy month to month. Gold (New Dwelling Purchase) is the only sub-component climbing steadily every month of the six.
Two of these movements are one-off artefacts of how the index is built, not signs of accelerating inflation. Water & Sewerage jumped 5.8% over six months, but that’s an annual rate-setting cycle — local water authorities reset charges once a year, so the index sits flat for months and then steps up all at once, exactly as it did in July. Property Rates sit at a flat 0.00% for the same reason: council rates are revalued annually, not monthly, and no revaluation has landed yet this year. Neither is a genuine trend to extrapolate from.
New Dwelling Purchase is different. It’s the cost, from a fixed sample of project home builders and volume developers, of purchasing a new house or unit as an owner-occupier — and it has climbed in every single one of the last six months, for a cumulative 3.0% rise, comfortably the fastest sustained mover of any sub-component APN tracks in this basket. That’s a genuine trend, not a base-effect artefact, and it’s consistent with builders passing through higher input costs rather than absorbing them.
Reading it straight
The honest summary is that this print is not the disinflation story the headline number alone suggests. All Groups CPI easing to 3.5% is real, but it’s driven by items the Trimmed Mean is specifically designed to look past — and that measure hasn’t moved. Housing’s contribution to annual inflation remains the largest of any group, and within Housing, the component most directly tied to the cost of building a new home is accelerating, not slowing. Whether that shows up in APN’s own Inflation node (21220) — a quarterly composite of headline CPI, Housing CPI, construction PPI and inflation expectations, last certified at Z +2.1049σ for the June 2026 quarter — won’t be testable until the September quarter data lands; this monthly indicator print sits outside that composite’s quarterly cadence.
A130393720C) and Table 3 (Group/Sub-group/Expenditure Class, Weighted Average of Eight Capital Cities). All index-level figures sourced directly from the published monthly time-series workbooks, not rounded headline text. Sub-component 6-month changes computed from Original index numbers, January to July 2026 inclusive. Reference period for the current CPI series is September 2025 = 100.0. Cross-referenced node: 21220 (Inflation, quarterly composite).
Findings are presented on the basis of data and evidence alone.