
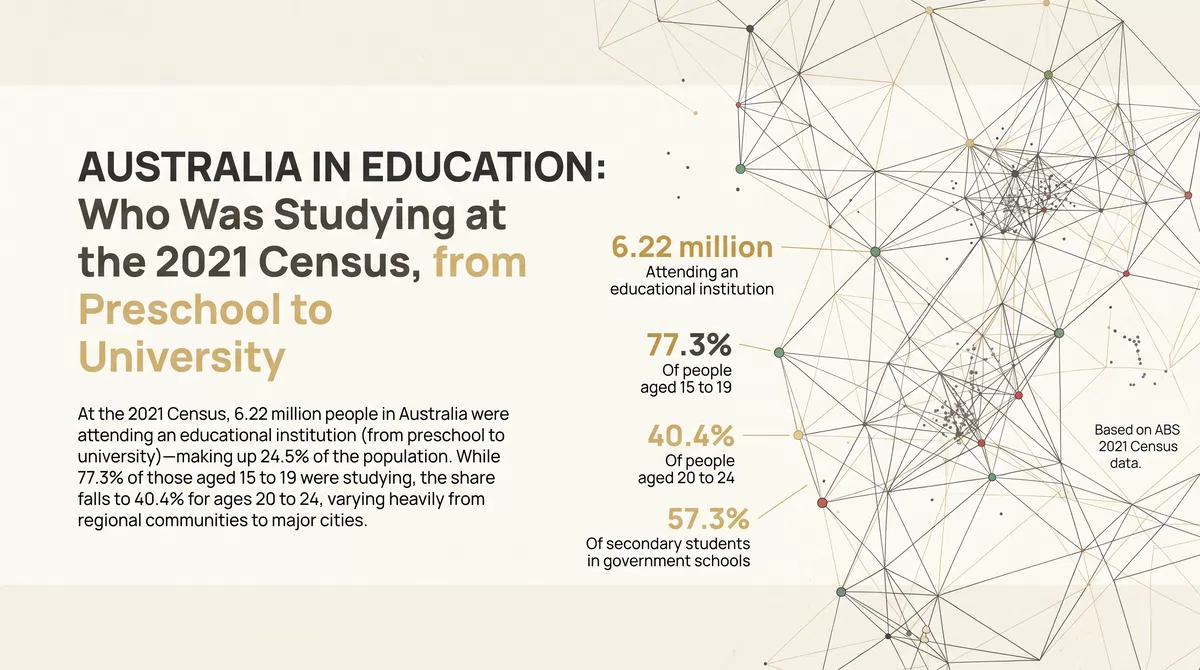

At the 2021 Census, 6.22 million people in Australia were attending an educational institution, from preschool to university: 24.5% of the population. School students made up 60% of them. Among people aged 15 to 19, 77.3% were studying, and among those aged 20 to 24, 40.4%. That second figure depends heavily on where a person lives: it was 23.6% in localities of 201 to 999 residents and 46.4% in localities of 20,000 or more.
Attendance is as stated at the Census of 10 August 2021, and people are counted where they usually live.
What the Census asked
The Census asks whether each person is attending a school or other educational institution, and if so what type. Table G15 of the Census General Community Profile reports the answers by type of institution. Its “not stated” row holds 1.46 million people, most of whom did not answer the question at all, so it is not a count of students and is left out here. That leaves 6.22 million people who named a type of institution, which agrees with the 6.21 million the Census reports as attending in its table of attendance by age.
By level
People attending an educational institution, by type, Australia, 2021 (thousands)
APN calculation based on Australian Bureau of Statistics data: Census of Population and Housing: General Community Profile, 2021, Table G15 (type of educational institution attending). People attending each type of institution, in thousands, with each type’s share of everyone who stated one. Australia.
Primary schools had 2.08 million students and secondary schools 1.63 million, 3.70 million between them. Universities and other higher education providers had 1.19 million, and vocational education, which includes TAFE and private training providers, 601,901. Preschools had 484,185 children.
By age
Share of each age group attending an educational institution, 2021
APN calculation based on Australian Bureau of Statistics data: Census of Population and Housing: General Community Profile, 2021, Table G01 (selected person characteristics). People attending an educational institution as a share of all people of that age. Australia.
Attendance is close to universal between the ages of 5 and 14, at 93.3% of all children that age, a figure that counts those whose form gave no answer as not attending. It falls to 77.3% for people aged 15 to 19 and 40.4% for those aged 20 to 24. Among people aged 25 and over the share is 6.0%, but they are numerous: 1.06 million students were 25 or older, about 17% of all those attending.
Government, Catholic and other schools
Share of school students by kind of school, primary and secondary, 2021
APN calculation based on Australian Bureau of Statistics data: Census of Population and Housing: General Community Profile, 2021, Table G15 (type of educational institution attending). Share of primary students and of secondary students attending each kind of school. Australia.
Government schools taught 68.5% of primary students and 57.3% of secondary students. The difference is taken up by both parts of the non-government sector: Catholic schools had 19.1% of primary students and 22.8% of secondary students, and other non-government schools 12.2% and 19.8%. The non-government share is higher in secondary than in primary school in every state and territory. Among secondary students it was highest in South Australia, at 44.8%, and lowest in the Northern Territory, at 35.2%.
University and vocational study
Of the 1.19 million university and other higher education students, 68.5% were studying full-time and 44.1% were aged 25 or over. Vocational education runs the other way: 64.8% of its 601,901 students were part-time. Women were 58.2% of university students and 54.3% of vocational students.
By state and territory
Share of people aged 15 to 19 attending an educational institution, by state and territory, 2021
APN calculation based on Australian Bureau of Statistics data: Census of Population and Housing: General Community Profile, 2021, Table G01 (selected person characteristics). People aged 15 to 19 attending an educational institution as a share of all people that age, with the share for people aged 20 to 24 in brackets. The Northern Territory’s figures are lowered by a higher share of people who did not answer.
The Australian Capital Territory (82.1%) and Victoria (81.9%) had the highest shares of people aged 15 to 19 in education, and Queensland (72.6%) the lowest of the states. The spread is wider for people aged 20 to 24: 50.4% in the Australian Capital Territory and 45.8% in Victoria, against 33.0% in Queensland and 30.6% in Tasmania. The Northern Territory’s figures, 54.2% and 18.6%, are not directly comparable: 10.4% of its residents fell in the not-stated row, against 5.7% nationally, and anyone who did not answer is counted here as not attending.
By size of place
Share of people aged 15 to 24 attending an educational institution, by the size of the locality
APN calculation based on Australian Bureau of Statistics data: Census of Population and Housing: General Community Profile, 2021, Table G01 (selected person characteristics). People aged 15 to 24 attending an educational institution as a share of all people that age, with the share for people aged 20 to 24 in brackets. Localities are ABS Suburbs and Localities, grouped by their number of residents.
The larger the place, the more of its young people are studying. In localities with 201 to 999 residents, 48.0% of people aged 15 to 24 were attending an educational institution; in the 143 localities with 20,000 or more, 61.9%. Nationally the figure is 58.1%. The difference is larger among people in their early twenties. For those aged 15 to 19 the share runs from 67.7% to 81.1%; for those aged 20 to 24 it roughly doubles, from 23.6% to 46.4%. Taken together, localities with 200 or fewer residents, which are not reported individually, had 41.8% of their 15 to 24 year-olds in education.
The Census counts people where they usually live. A student who moves from a country town to a city to study is counted in the city, so part of this pattern reflects where students live while they study, not only where they grew up.
How localities are spread
Number of localities by share of people aged 15 to 24 attending an educational institution
APN calculation based on Australian Bureau of Statistics data: Census of Population and Housing: General Community Profile, 2021, Table G01 (selected person characteristics). The 5,083 localities with more than 200 residents and at least 50 people aged 15 to 24, by the share of that age group attending an educational institution, with the share of the age group living in each group.
Across the 5,083 localities with more than 200 residents and at least 50 people aged 15 to 24, the middle locality had 54.9% of that age group in education. In 658 localities the share was 70% or more, and those localities are home to 17.5% of the age group. In 691 it was under 40%, and those hold 6.6%.
Where this sits in the index
The APN Meridian™ (Education Value Index) (24130) brings together five measures of education for each locality: the supply and mix of schools, tertiary study and distance to a higher education provider, the qualifications residents hold, the change in incomes and qualifications between Censuses, and early childhood services. This article sets out the Census attendance figures that stand behind several of them.
What this does not show
Attendance is not attainment: the figures count who was enrolled, not what they completed or how well they did. Rates by age are of everyone in the age group, including people who did not answer, so they are slightly understated everywhere and more so in the Northern Territory. Students are counted at their usual address, which lifts the figures for places near universities. The Census was taken on 10 August 2021, seventeen months after Australia’s international border closed in March 2020, a period in which arrivals of international students were reduced. Results from the August 2026 Census will update these figures.
- Australian Bureau of Statistics (Reference period: 2021) Census of Population and Housing: General Community Profile, tables G01 and G15, by Suburbs and Localities, state and Australia [https://www.abs.gov.au/census/find-census-data/datapacks], ABS Website, accessed 11 October 2026.
ABS material is used under a Creative Commons Attribution 4.0 International licence. Calculations, standardisations and index readings are APN’s and are not attributable to the ABS.
Disclaimer
The analysis and information contained in this publication are for general informational and strategic purposes only and do not constitute financial, investment, legal, or any other form of professional advice. Australian Property Network is not a licensed financial advisor. Property values and market conditions can go up or down. Before making any property or investment decisions, you must conduct your own thorough research and seek independent professional advice tailored to your specific circumstances. Images are for illustrative purposes only. E.&O.E.
Findings are presented on the basis of data and evidence alone.
