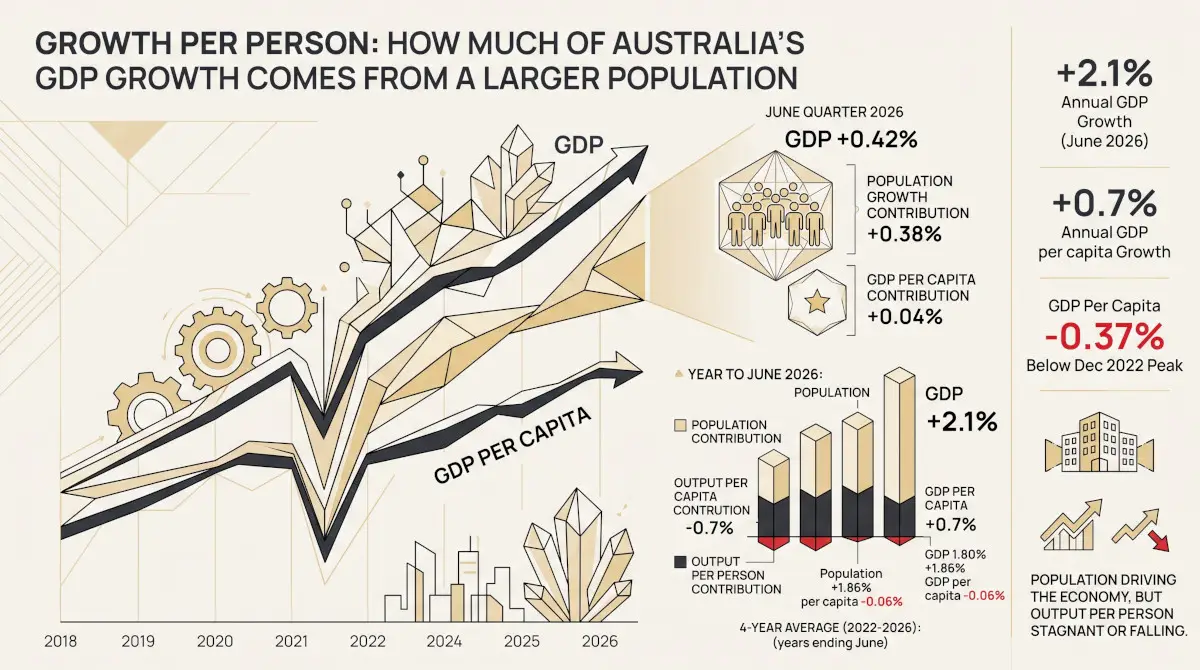
Australia’s economy grew 0.4% in the June quarter of 2026, taking real (chain-volume) GDP to $699,461 million — up 2.1% on a year earlier, according to the Australian Bureau of Statistics’ National Accounts, released 2 September 2026. Both figures are unremarkable on their own, and so is the two-year picture behind them: real GDP has grown in every quarter since mid-2024, but the pace of that growth has moved unevenly, without settling into either a clear acceleration or a clear slowdown.
Two years without a direction
Real GDP has risen from $672.0 billion in the June quarter of 2024 to $699.5 billion two years later — a real increase of 4.1%, in line with the ABS’s own published +2.1% year-on-year rate for the latest quarter. The rise has not been a straight line. The dollar gain from one quarter to the next has ranged from as little as $1.4 billion to as much as $5.8 billion, with no consistent pattern to which quarters are strong and which are weak: the two largest quarterly gains of the past two years, in the June and December 2025 quarters, each sit between two considerably smaller ones.
Real GDP (chain-volume measure, seasonally adjusted), quarterly levels, June 2024 – June 2026
Source: ABS 5206.0 National Accounts, Table 1, GDP Chain Volume Measures, Seasonally Adjusted. The vertical axis does not start at zero, to keep the quarter-to-quarter movement legible — the full range shown here is a rise of just over 4% across two years.
None of the last nine quarters stands out as a genuine outlier once put on this chart. The line climbs steadily, sometimes more steeply and sometimes more gently, but it does not flatten and it does not accelerate into anything that looks like a new phase. The clearest description of June 2026 is that it continues an already-established, unspectacular expansion, not that it marks a turning point in either direction.
A quiet uptick in the broader reading
APN Codex’s Employment & GDP composite (Node 21230) blends this GDP result with two labour-market readings — the national unemployment rate and a regional breakdown of it — into a single standardised score, measuring how the combination compares with its own multi-year history. That composite firmed from a below-average −0.18σ in the December 2025 quarter to +0.09σ in the March 2026 quarter, and the June 2026 quarter reading continues that direction at roughly +0.10σ (see the methodology note below on its certification status).
The size of the move is worth being honest about: a shift from −0.18σ to +0.10σ is a return to roughly the middle of the pack, not a signal of strength. Combined with the picture above, the clearest description of the current quarter is “unremarkable in a good way” — output kept expanding, the labour market didn’t deteriorate, and nothing in either series is flashing a warning. It is also nothing to get excited about.
Findings are presented on the basis of data and evidence alone.