
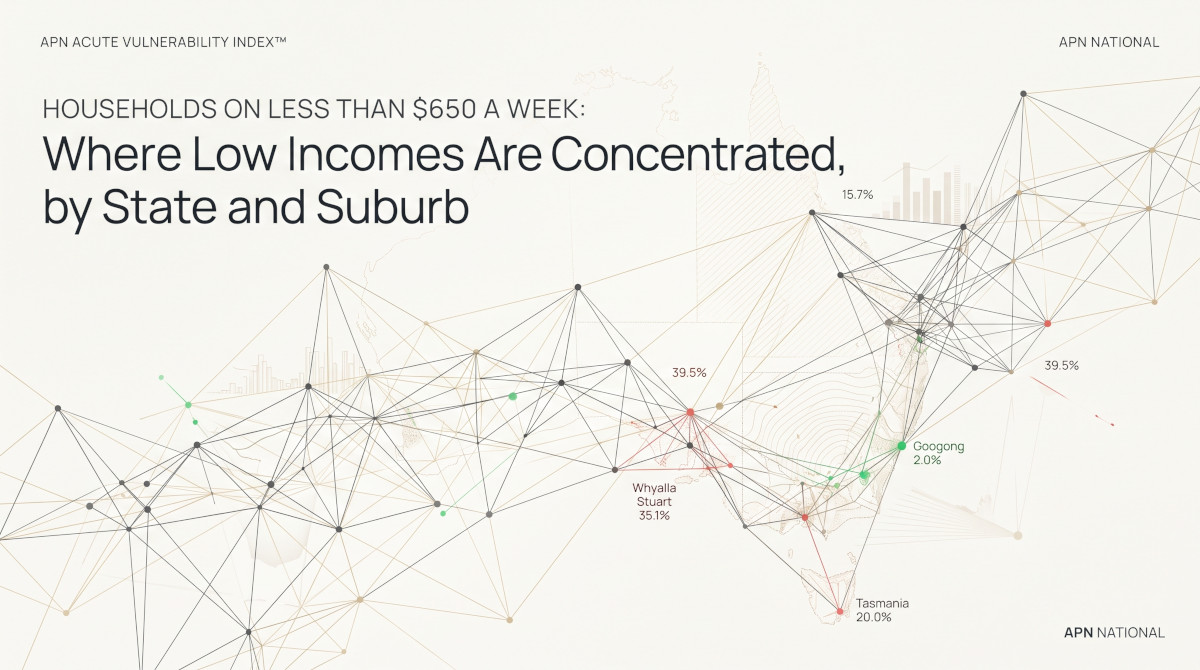

At the 2021 Census, 1.43 million Australian households had a total income of less than $650 a week before tax: 15.7% of households, leaving out those in which no one stated an income. Most were not families. Lone-person and group households made up 29% of all households and 73% of those under $650. The share ran from 8.6% in the Australian Capital Territory to 20.0% in Tasmania, and among larger suburbs from 2.0% to 35.1%.
Household income is total income before tax, as stated at the Census of 10 August 2021.
What the measure is
The Census asks each person for their income and the ABS adds the answers within a household. Table G33 of the Census General Community Profile reports the result in weekly brackets for 9.3 million households. This article counts a household as below the line if its total income was negative, nil, or in any bracket up to $500 to $649. Households in which no one stated an income, 1.7% of the total, are left out of the rates. Households in which only some members stated an income, 5.2%, cannot be placed in a bracket; they are counted among all households but never among those under $650, so the shares here are slightly understated. Leaving those households out as well, as the ABS does in its own Census summary, gives 16.5%. About 89% of the households with partial income stated are family households, so the family share is understated by more: it is 6.4% with them left out, and 40.3% for lone-person and group households.
The line is a fixed dollar amount and takes no account of how many people share the income. A person living alone on $600 a week is counted; a family of five on $900 is not. For scale, $650 is about 37% of the national median household income of $1,746 a week reported in Household Income Across Australia’s Suburbs in 2021.
Where the line falls in the income distribution
Households by total weekly income, Australia, 2021
APN calculation based on Australian Bureau of Statistics data: Census of Population and Housing: General Community Profile, 2021, Table G33 (total household income (weekly) by household composition). Share of households in each weekly income bracket, of households that stated an income. Australia. The first six rows are the brackets below $650. Bars do not sum to 100%: households with partial income stated are in the base and in no bracket.
Of the 1.43 million households under $650, 62% were in the two brackets from $400 to $649, and the $400 to $499 bracket alone held 5.6% of all households that stated an income. A further 166,449 households, 11.7% of the group, reported a negative or nil income.
Who is below it
Share of households with an income under $650 a week, by type of household, 2021
APN calculation based on Australian Bureau of Statistics data: Census of Population and Housing: General Community Profile, 2021, Table G33 (total household income (weekly) by household composition). Share of households with a total weekly income under $650, of households that stated an income. Australia. The ABS classes lone-person and group households together as non-family households.
The measure divides households sharply by type. Among family households, 5.9% had less than $650 a week. Among lone-person and group households the share was 39.5%. Because the line is not adjusted for household size, part of that gap follows from arithmetic: one income is being compared with two or more.
By state and territory
Share of households with an income under $650 a week, by state and territory, 2021
APN calculation based on Australian Bureau of Statistics data: Census of Population and Housing: General Community Profile, 2021, Table G33 (total household income (weekly) by household composition). Share of households with a total weekly income under $650, of households that stated an income. The shares for family households and for lone-person and group households are shown in brackets.
Tasmania (20.0%) and South Australia (18.6%) had the highest shares, and the Northern Territory (11.3%) and the Australian Capital Territory (8.6%) the lowest. New South Wales, Victoria, Queensland and Western Australia were within one percentage point of each other. The differences between states come mainly from lone-person and group households: 47.9% of them were under $650 in Tasmania and 45.6% in South Australia, against 22.1% in the Australian Capital Territory. On this article’s count the share for family households was below 7% everywhere.
By size of place
Share of households with an income under $650 a week, by the size of the locality
APN calculation based on Australian Bureau of Statistics data: Census of Population and Housing: General Community Profile, 2021, Table G33 (total household income (weekly) by household composition). Share of households with a total weekly income under $650, of households that stated an income. Localities are ABS Suburbs and Localities, grouped by their number of households.
The size of a place makes little difference. The share was 16.7% in localities with 100 to 399 households and 15.1% in the 112 localities with 8,000 or more. Taken together, localities with fewer than 100 households had a share of 13.4%.
How localities are spread
Number of localities by share of households with an income under $650 a week
APN calculation based on Australian Bureau of Statistics data: Census of Population and Housing: General Community Profile, 2021, Table G33 (total household income (weekly) by household composition). The 6,109 localities with at least 100 households, by the share of households with an income under $650 a week, with the share of households living in each group.
Across the 6,109 localities with at least 100 households, the middle locality had 15.1% of its households under $650 a week, close to the national figure. In 350 localities the share was 30% or more; those localities hold 2.3% of households. In 1,344 it was under 10%, and those hold 18.7%.
The highest and lowest shares among larger suburbs
The lists below are limited to the 1,453 localities with at least 2,000 households. In 19 of them the share was 30% or more, and in 24 it was under 5%.
| Locality | State | Households | Income under $650 a week | Share of households (excluding income not stated) |
|---|---|---|---|---|
| Whyalla Stuart | SA | 2,826 | 951 | 35.1% |
| Nambucca Heads | NSW | 2,947 | 973 | 34.8% |
| Mandurah | WA | 4,110 | 1,377 | 34.7% |
| Wonthaggi | Vic. | 2,361 | 782 | 34.6% |
| Moe | Vic. | 4,159 | 1,354 | 34.0% |
| Norlane | Vic. | 3,561 | 1,118 | 32.9% |
| Bongaree | Qld | 4,053 | 1,282 | 32.8% |
| Christie Downs | SA | 2,130 | 673 | 32.7% |
| Villawood | NSW | 2,000 | 633 | 32.7% |
| Victor Harbor | SA | 2,097 | 659 | 32.3% |
The ten highest are spread across five states: regional and coastal towns such as Nambucca Heads, Wonthaggi, Moe, Bongaree and Victor Harbor, the centre of Mandurah, and suburbs of Whyalla, Geelong, Adelaide and Sydney. In each, about one household in three had less than $650 a week.
| Locality | State | Households | Income under $650 a week | Share of households (excluding income not stated) |
|---|---|---|---|---|
| Googong | NSW | 2,301 | 46 | 2.0% |
| Piara Waters | WA | 4,598 | 142 | 3.1% |
| Aintree | Vic. | 2,164 | 77 | 3.6% |
| Brabham | WA | 2,854 | 110 | 3.9% |
| Bonner | ACT | 2,116 | 83 | 4.0% |
| Moranbah | Qld | 2,634 | 103 | 4.0% |
| The Ponds | NSW | 4,513 | 183 | 4.1% |
| Kingston | ACT | 3,293 | 136 | 4.2% |
| Botanic Ridge | Vic. | 2,084 | 87 | 4.2% |
| Kellyville Ridge | NSW | 3,117 | 132 | 4.3% |
APN calculation based on Australian Bureau of Statistics data: Census of Population and Housing: General Community Profile, 2021, Table G33 (total household income (weekly) by household composition). Share of households with a total weekly income under $650, of households that stated an income. Localities with at least 2,000 households. Counts are as published by the ABS, which makes small random adjustments to protect confidentiality.
Eight of the ten lowest are recently built estates on the edges of the capitals (Googong, Piara Waters, Aintree, Brabham, Bonner, The Ponds, Botanic Ridge and Kellyville Ridge), with the mining town of Moranbah and Kingston in inner Canberra.
Where this sits in the index
The APN Acute Vulnerability Index™ (24126) combines five measures for each locality: the share of households on a low income, the share in social housing, the share of lone-person households, the share of one-parent families and the ABS Index of Relative Socio-economic Disadvantage. This article reports the first of the five.
What this does not show
A low stated income for one week is not the same as low means. The figures take no account of savings, assets, housing costs or whether a home is owned outright, and a household can report a nil or negative income while running a business or living on savings. The line is not adjusted for household size, so it counts people living alone more readily than families. Income is before tax and as stated on the Census form. Results from the August 2026 Census will update these figures.
- Australian Bureau of Statistics (Reference period: 2021) Census of Population and Housing: General Community Profile, table G33, by Suburbs and Localities, state and Australia [https://www.abs.gov.au/census/find-census-data/datapacks], ABS Website, accessed 10 October 2026.
ABS material is used under a Creative Commons Attribution 4.0 International licence. Calculations, standardisations and index readings are APN’s and are not attributable to the ABS.
Disclaimer
The analysis and information contained in this publication are for general informational and strategic purposes only and do not constitute financial, investment, legal, or any other form of professional advice. Australian Property Network is not a licensed financial advisor. Property values and market conditions can go up or down. Before making any property or investment decisions, you must conduct your own thorough research and seek independent professional advice tailored to your specific circumstances. Images are for illustrative purposes only. E.&O.E.
Findings are presented on the basis of data and evidence alone.
