Australia’s total fertility rate was 1.481 babies per woman in 2024, the lowest since at least 1975 and down from 1.917 in 2011. The fall is concentrated among women under 35.
Lone-person households grew 25.5% between the 2011 and 2021 Censuses, against 15.9% for couples with children, which remain the most common type. In SA and Tasmania people living alone already outnumber couples with children.
79.4% of households headed by someone aged 75 and over own their home outright, against 29.5% of all households. How tenure, dwelling type, household size and housing costs change with age.
Under the ABS medium projection, Australians aged 65 and over rise from 4.43 million in 2022 to 7.42 million by 2046, and those aged 85 and over from 0.55 million to 1.43 million.
In the year to June 2025 the capital cities grew 1.76% and the rest of the states 1.08%, taking 77% of national growth. The capitals grow through overseas migration while Sydney and Melbourne lose residents internally.
By June 2025 Australia’s population was 369,000 below the 2017-based medium projection and 207,000 above the 2022-based one. How two editions of ABS projections compare with what happened.
Western Australia grew fastest in the year to March 2026 and Tasmania slowest. Overseas migration was the largest source of growth in every state, while New South Wales lost 20,818 people interstate and Queensland gained 14,718.
Australia’s average household fell from 2.6 people to 2.5 between the 2016 and 2021 Censuses. One-person households rose to 25.6% of the total, and the ABS projections disagree on whether that continues.
Between 2011 and 2026 the number of Australians aged 75 to 79 rose 86% while children under five rose 3.2%. The median age went from 37.2 to 38.5 and the most common single age from 39 to 31.
There were 27.2 Australians aged 65 and over for every 100 aged 15 to 64 in March 2026, up from 20.5 in 2011. The ratio rose fastest when the borders closed and barely moved while migration was at its highest.
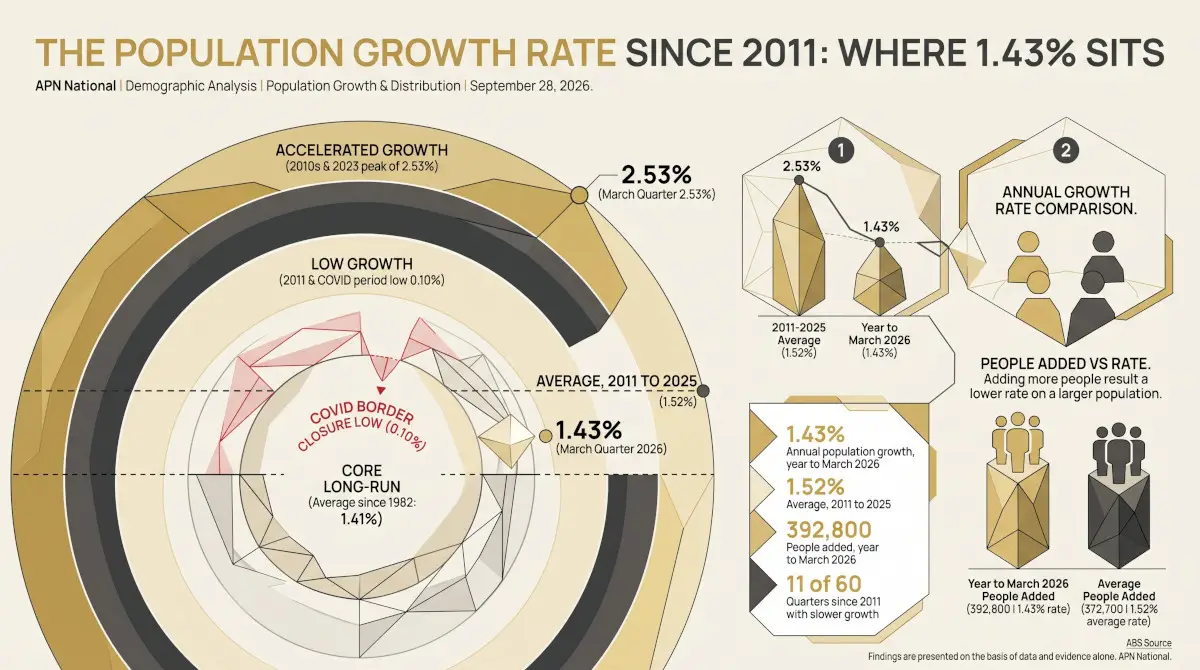
Australia’s population grew 1.43% in the year to March 2026: below its 2011–2025 average of 1.52%, slower than in all but 11 of those 60 quarters, and close to its average since 1982.
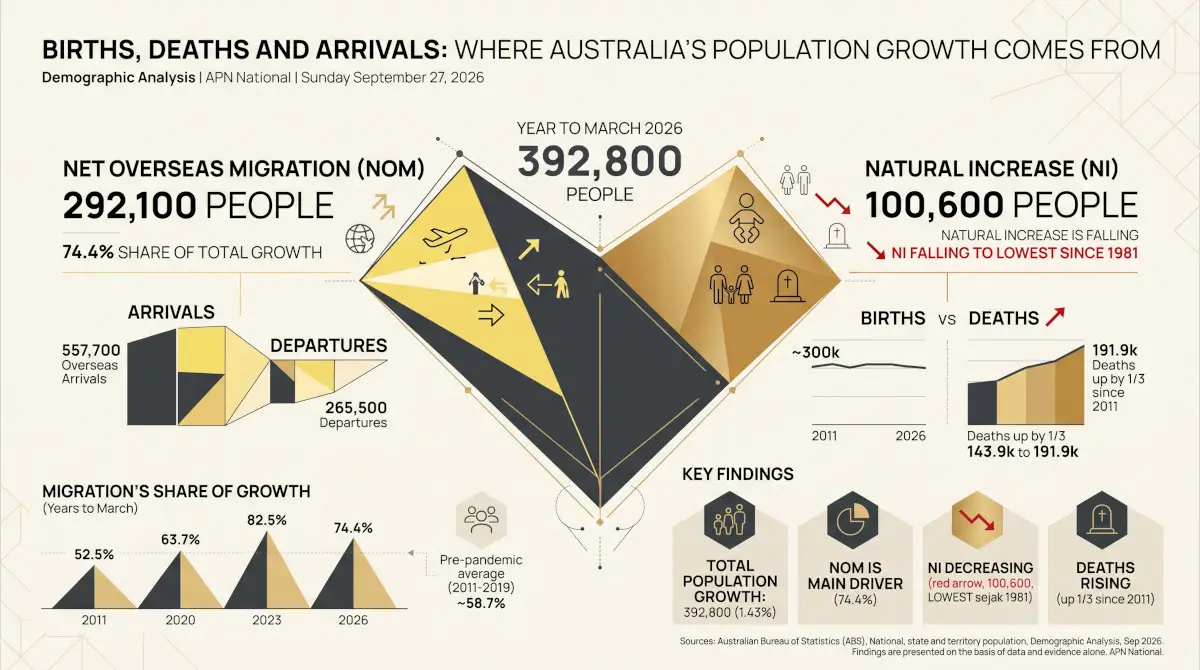
Three in every four of the 392,800 people added to Australia’s population in the year to March 2026 came from net overseas migration. Births have held near 300,000 a year while deaths have risen by a third, so natural increase...
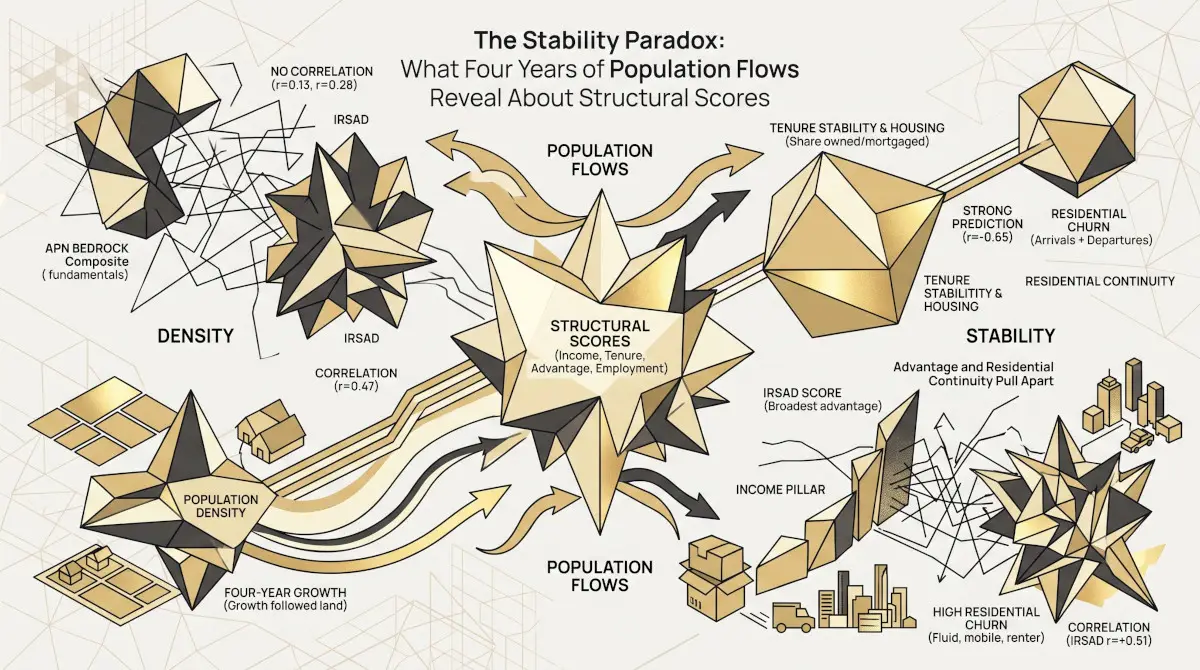
Structural scores measured in 2021 predicted essentially nothing about where Australia's population grew over the following four years — density did. But residential stability was predictable, by one measure: tenure structure anticipated four years of churn at r = −0.54....
A pre-registered "downsizing dead end" hypothesis failed twice: the age–building relationship is weak and bends upward in the oldest LGAs, and 55% of over-65s live in the highest-building metro quintiles. If a dead end exists, it's product mix — not...
Outright home ownership tracks age almost perfectly across Australia's LGAs (+0.884) and tracks income negatively (−0.489). Mining boomtowns and harbour suburbs share the same high incomes but sit at opposite ends of the ownership scale — the real driver is...
Population growth tracks building approvals closely across 546 LGAs (r = 0.952) — but Western Australia absorbs growth at 4.63 persons per approval, nearly double Victoria and NSW. Splitting population growth by migration source reveals why: inner and middle-ring Perth...
Population growth and building approvals correlate strongly across 70 LGAs (r = 0.84) — but 24 LGAs depart from that pattern by 1.75 dwellings per 1,000 residents or more. Eleven established, mostly high-advantage suburbs under-build relative to their own growth;...
Almost two million taxable individuals live in one of 83 LGAs where a decade of nominal income growth becomes flat-to-negative once inflation is applied. An APN LGA Intelligence analysis of a decade of ATO taxation data, CPI-deflated, across all 531...
Sydney's median taxable income grew 51.5% nominally over the decade to 2023-24 - 16.3% in real terms. Melbourne's grew 16.2% nominally, a 10.9% real-terms decline. An APN LGA Intelligence analysis of a decade of ATO taxation data, CPI-deflated, across Australia's...
Brisbane (1.375M people) and Knox (163,820) sit within 1.5 points of each other on APN Bedrock composite — 55.86 and 54.38. Across the 50 most populous LGAs, population size explains less than 0.1 per cent of the variance in Bedrock...
Eighteen of the 40 most populous LGAs are net exporters of internal migrants — losing more residents to the rest of Australia than they gain — with overseas migration masking the loss on the headline growth figure. This analysis separates...
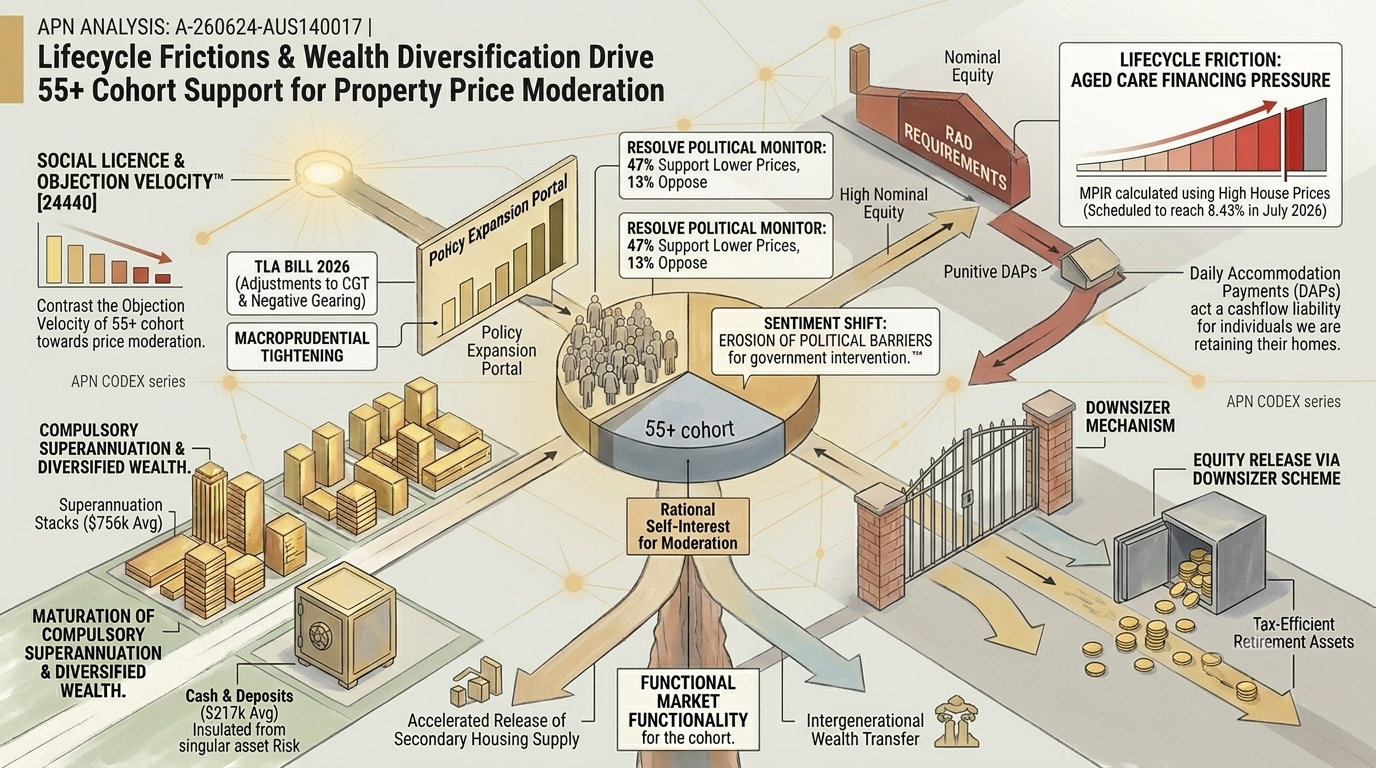
A structural shift in sentiment among Australia's 55+ demographic is recalibrating the political calculus of the residential property market. APN analysis identifies that this cohort's support for property price moderation is driven by rational, structural factors including wealth diversification through...
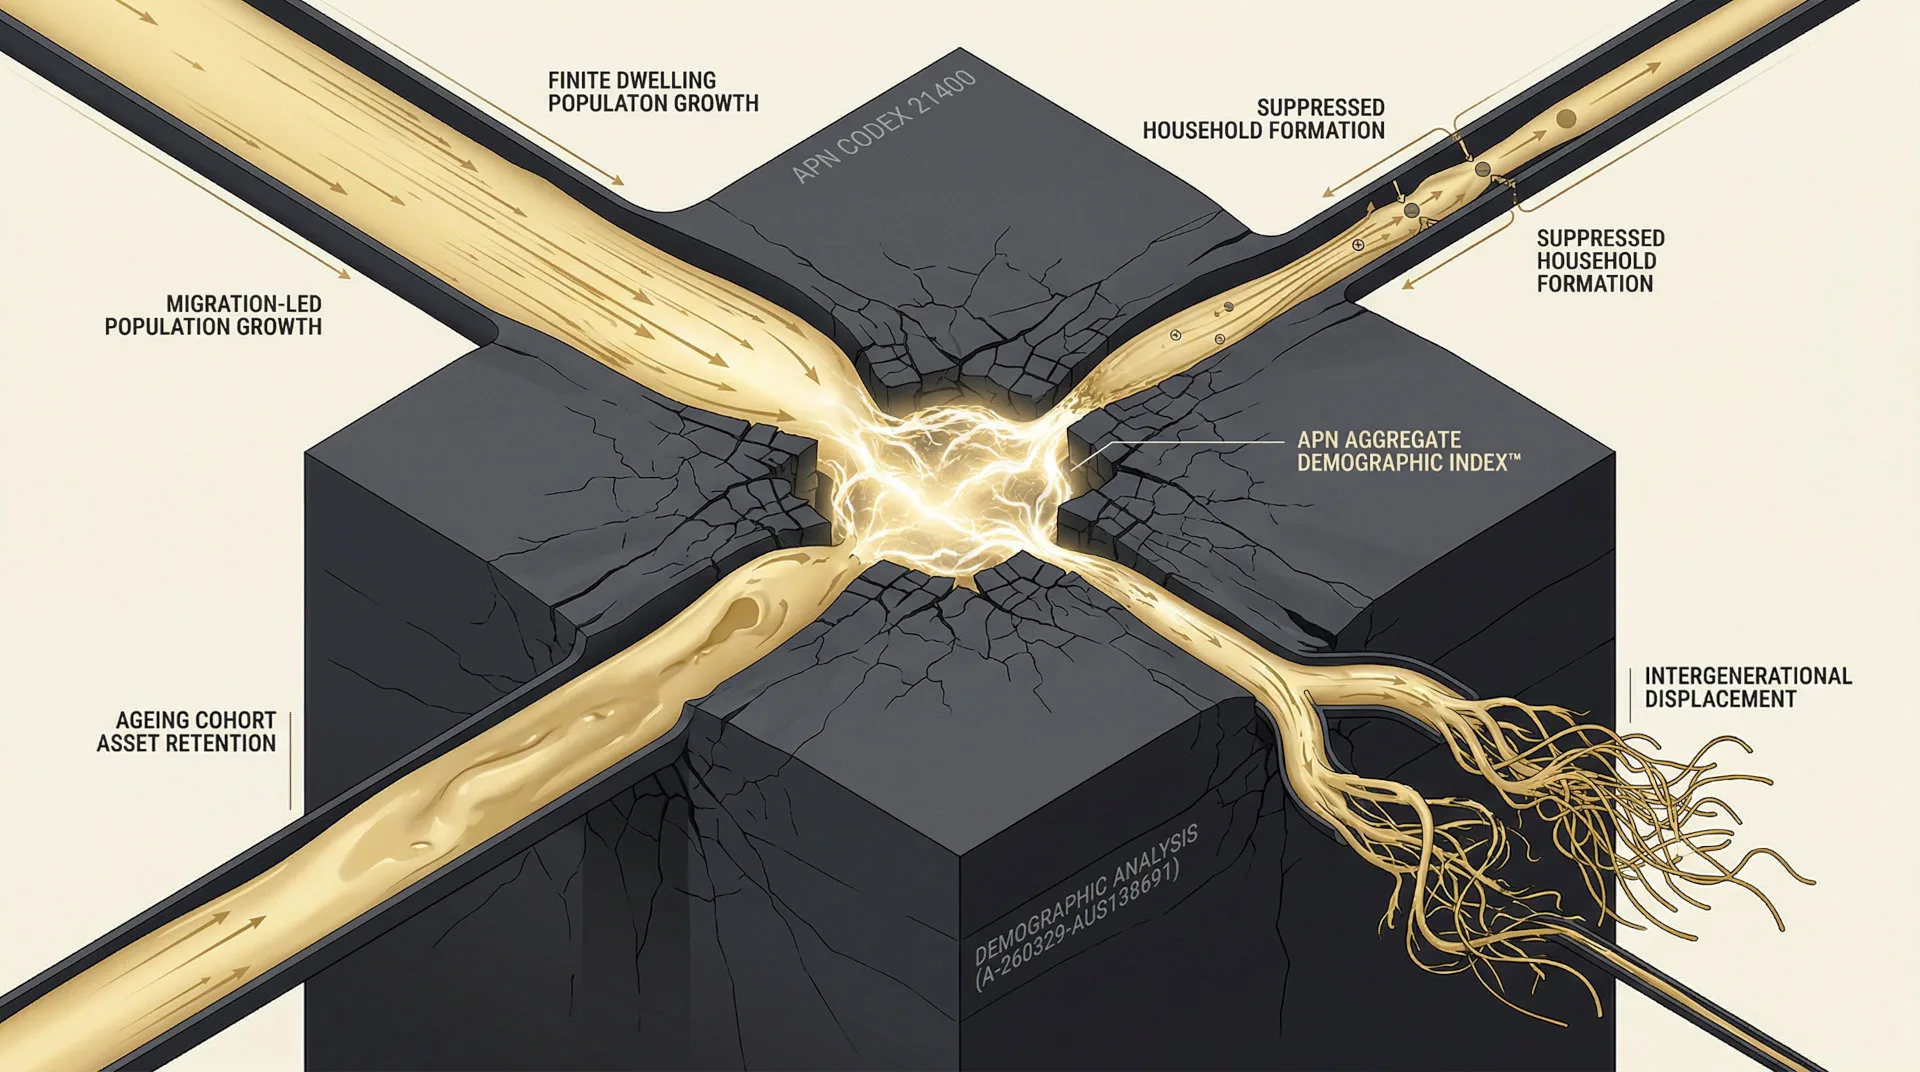
Compound demographic pressures are creating a structural constraint on the Australian housing market, limiting access for non-incumbent cohorts. APN analysis identifies that a combination of high migration-led population growth, significant asset retention by a debt-free senior cohort, and suppressed household...
Australia's residential supply pipeline is failing to keep pace with sustained, historically elevated demographic expansion. APN analysis shows that despite a statistical moderation in net overseas migration, the absolute population intake remains a greater than two standard deviation event against...
The era of easy growth in Australian property is over. APN analysis shows the market's value engine has pivoted from volume-driven capital growth to yield-driven rental returns, caused by a 'Hard Brake' on migration colliding with a delayed demand surge...
The reluctance of older Australian women to downsize is a rational rejection of a failed market, not an irrational attachment to the family home. APN analysis identifies a precise 'Product Fit'—the freehold, single-level, 2-bedroom villa with no exit fees—that can...
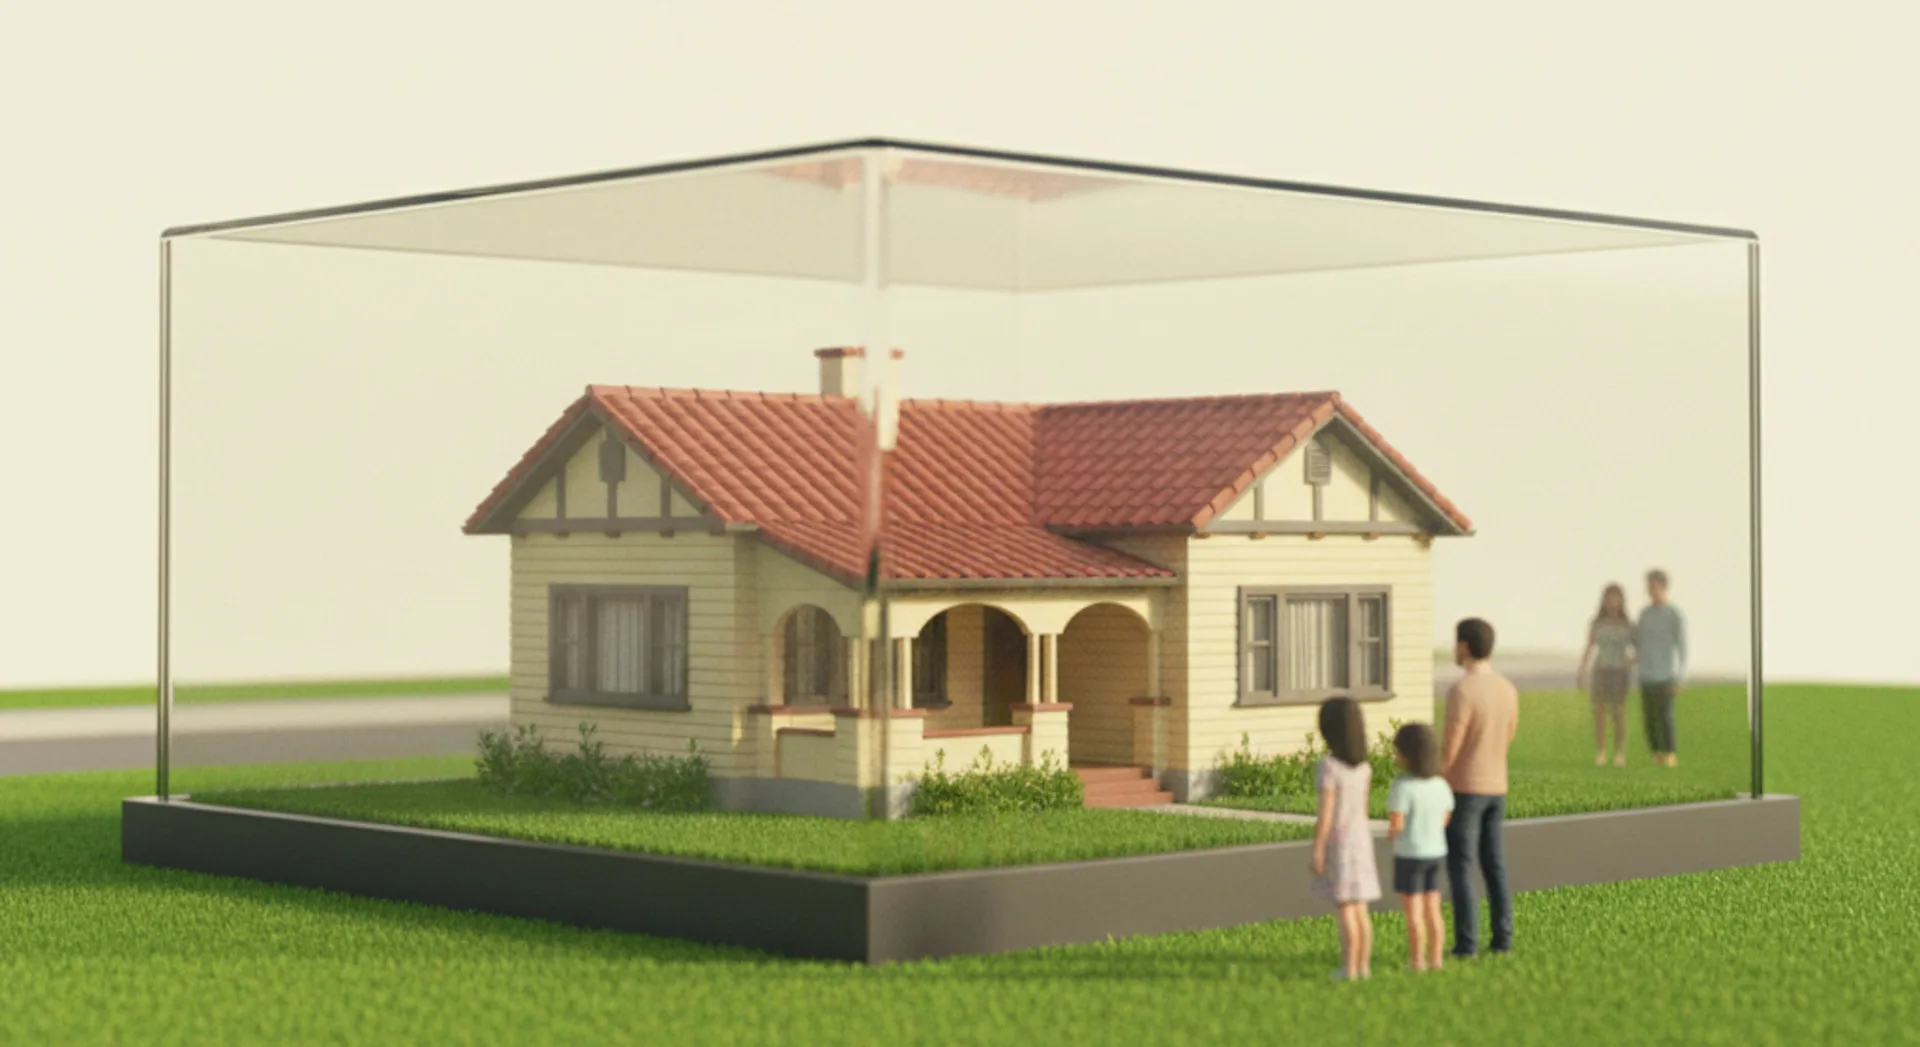
The rise of "forever suburbs," where ownership tenures exceed 20 years, signals a 'Great Stagnation' in Australian property. This insight deconstructs how our most desirable suburbs are slowly becoming suburban museums, locking out new generations and freezing the lifecycle of...
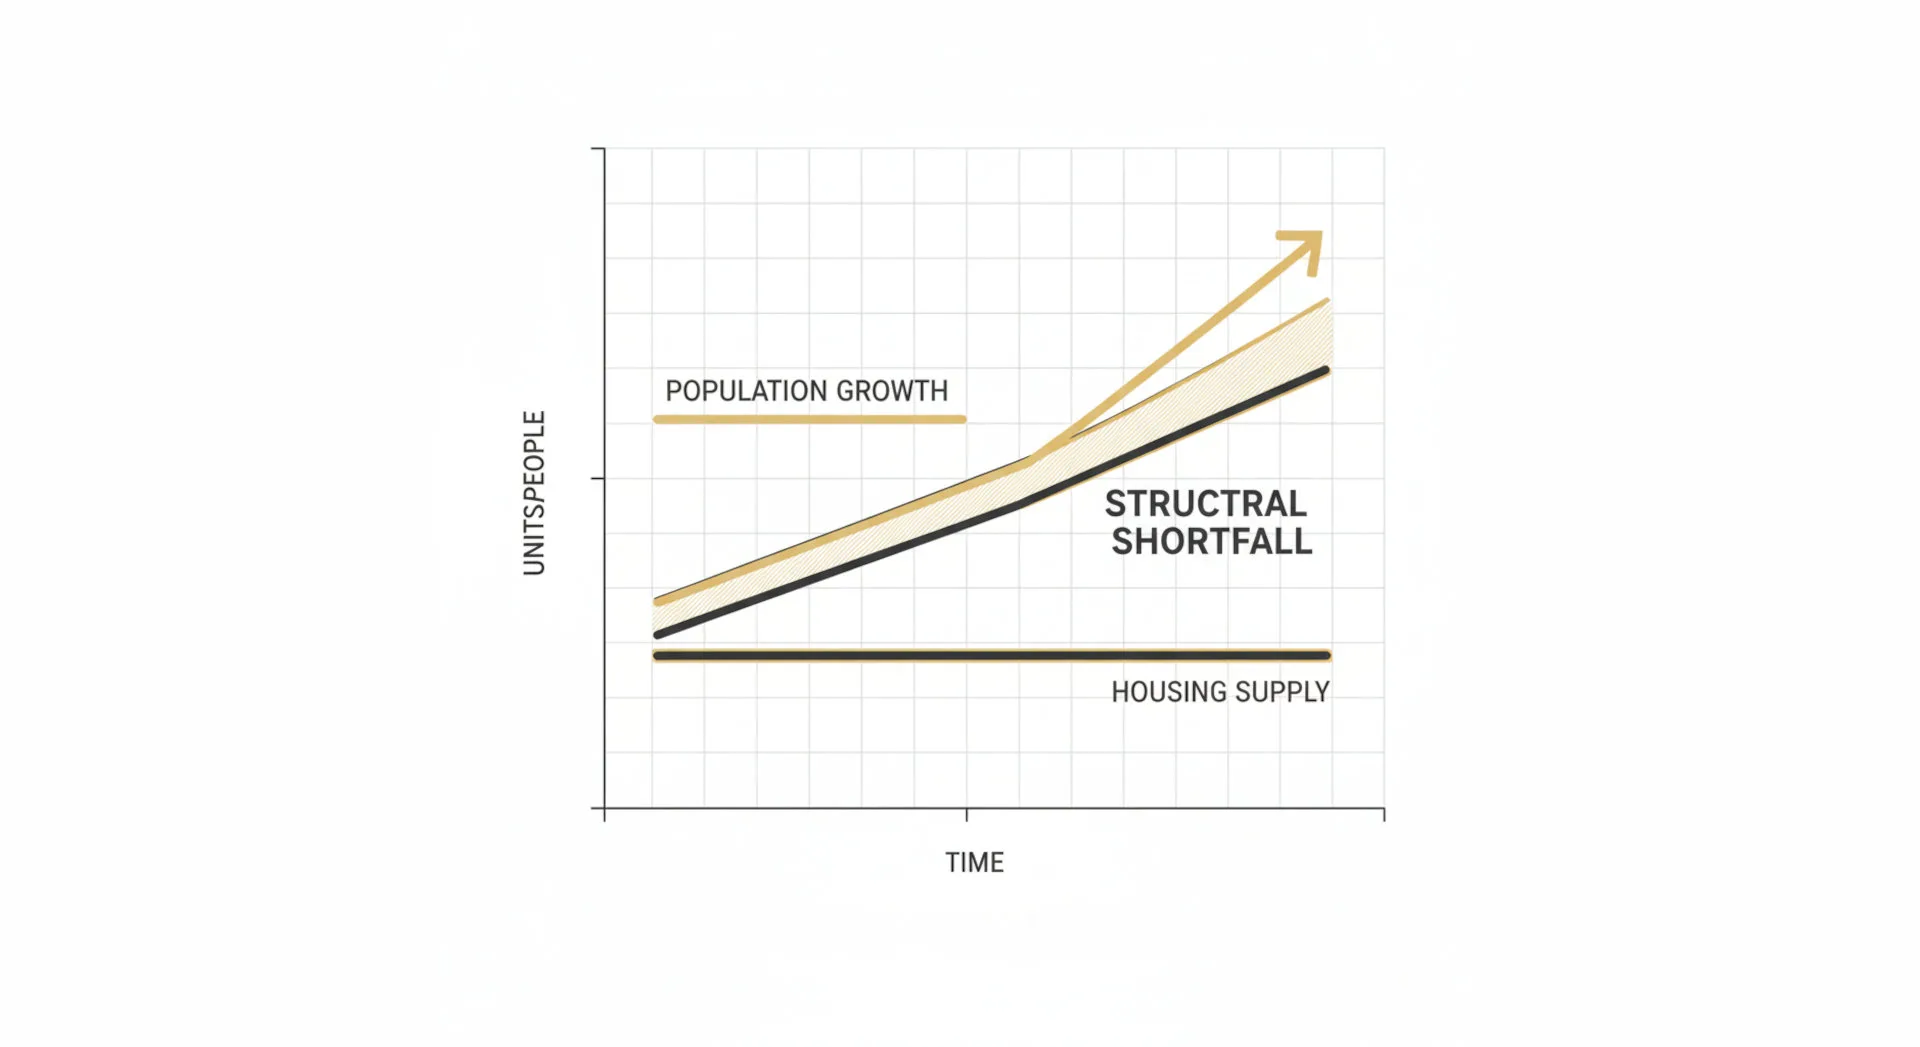
The latest official data confirms a dangerous disconnect: surging migration is adding population at double the pre-COVID rate, while housing construction is falling dramatically short of national targets. Our analysis deconstructs this structural shortfall and its profound implications.
Australia's property market appears to be a fortress of stability, but it is a demographic oasis in a depopulating world. This insight explores why our structural dependence on a shrinking global pool of migrants represents the single greatest systemic risk...
This analysis, based on McCrindle Research data originally published on Morningstar Australia, examines intergenerational housing affordability in Australia, revealing a stark contrast between Baby Boomers and Generation Z. In 1980, a Sydney house cost Baby Boomers 5.1 times their annual...