
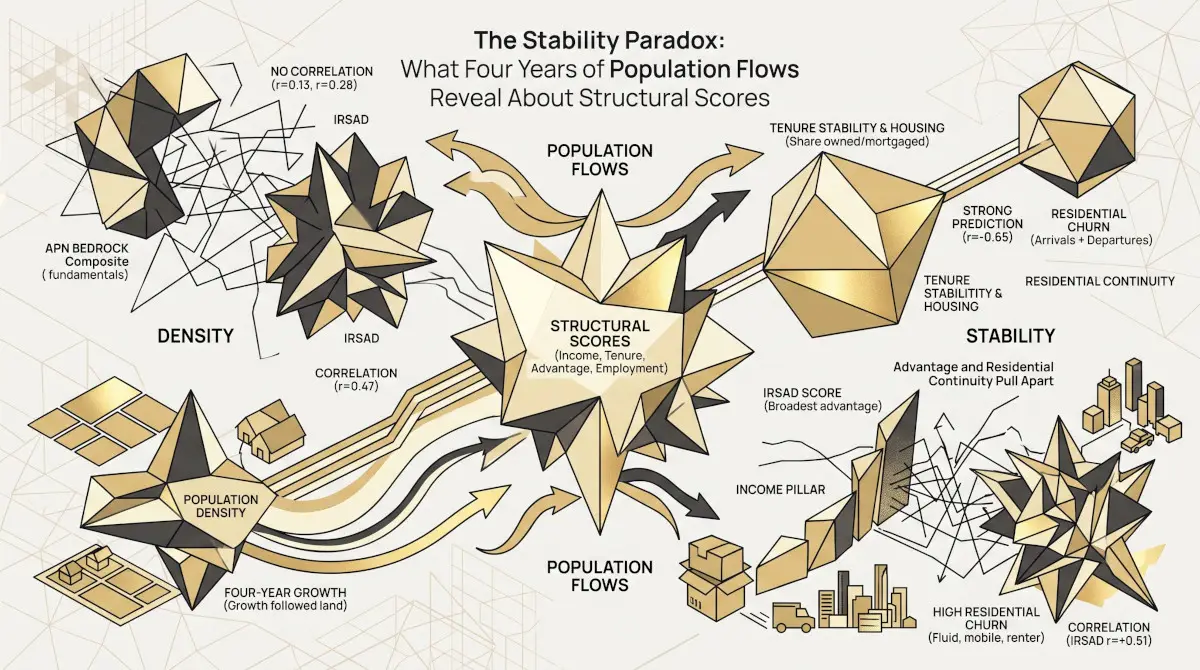

The Stability Paradox: What Four Years of Population Flows Reveal About Structural Scores
Between the 2021 Census and June 2025, Australia’s population grew by an average of 4.4 per cent across its local government areas — but the growth was anything but average. Across the 542 LGAs with full structural coverage, the four-year change ranged from a 6.1 per cent decline to growth approaching 28 per cent, and 72 LGAs recorded fewer residents in 2025 than in 2021. The 2021 Census took a detailed structural photograph of every one of these places — income, tenure, employment, advantage — immediately before those four years of movement occurred. That sequencing permits a test rarely run in Australian property analysis: did the structural photograph anticipate anything about what followed?
Growth Followed Land, Not Fundamentals
The short answer, for population growth, is no. The APN Bedrock™ composite measured in 2021 correlates with subsequent four-year population growth at r = 0.13 across the full national sample — under two per cent of the variance. The official SEIFA Index of Relative Socio-economic Advantage and Disadvantage (IRSAD) does little better at r = 0.28. Both correlations turn negative among LGAs above 100,000 residents.
What does correlate with growth is density. The logarithm of population density correlates with four-year growth at r = 0.47 — and density also correlates with both structural scores. Once density is held constant, the structural measures’ relationship with growth disappears entirely: the partial correlation falls to +0.02 for the Bedrock composite and +0.01 for IRSAD.
The mechanical explanation is unglamorous. Established, advantaged LGAs are substantially built out; growth requires land or approvals, and neither is a function of how a place scored on a 2021 structural index. Population growth over this window went where dwellings could go. Correlation does not imply causation, and none is asserted here — but the absence of correlation carries its own information: knowing an LGA’s 2021 structural quality told an observer essentially nothing about where Australians would move over the following four years.
Stability, However, Was Predictable — By One Measure
Population growth is a flux measure. A structural score named for stability should instead be tested against a stability outcome, and the national dataset now carries one: residential churn — total arrivals plus departures relative to population — measured over the four years following the Census.
Here one 2021 measure performs strikingly well. The ownership structure of an LGA’s housing — the share of dwellings owned outright or under mortgage, the Tenure Stability & Housing pillar of the Bedrock composite — correlates with subsequent churn at r = −0.51 among LGAs of 10,000 to 100,000 residents and r = −0.63 among LGAs above 100,000. Measured once, in August 2021, the tenure structure of a community anticipated four years of residential turnover with a strength cross-sectional social indicators rarely achieve.
Two caveats attach. Below 10,000 residents the relationship falls to statistical noise (r = 0.10) — small-population LGAs produce rate estimates too volatile to carry a signal, a recurring finding in this series. And the measure is causally adjacent to its outcome: owner-occupiers move less than renters as a matter of transaction cost and life structure, so part of this correlation is the definition doing the work. The strength of the persistence across four years is the finding; the direction alone would not be.
The Paradox: Advantage and Residential Continuity Pull Apart
The unexpected result is what advantage does. IRSAD — the broadest official measure of socio-economic advantage — correlates positively with churn at r = +0.51 nationally. Income tells the same story: the Bedrock income pillar runs at r = +0.54 with subsequent turnover among LGAs above 10,000 residents. Australia’s most advantaged local government areas are, on this evidence, its least residentially settled. High-income, high-advantage LGAs are disproportionately urban, professional and renter-mobile; their residents have the means to move and the labour markets that reward moving.
Advantage and residential continuity, in other words, are not the same axis — and across the upper end of the distribution they lean in opposite directions.
What This Means for Composite Scores — Including Ours
This finding has a direct consequence for any composite index that blends advantage with tenure, and the APN Bedrock™ composite is one. Its five equal-weighted pillars split against the churn outcome among LGAs above 10,000 residents: tenure (−0.54) and, more weakly, fiscal stress (−0.14) and labour (−0.13) lean toward residential continuity; income (+0.54) and socio-economic advantage (+0.57) lean toward mobility. Averaged together, the composite correlates with churn at just +0.28 nationally — the internal signals largely cancel.
The composite is not thereby wrong; it is measuring a blend. What the four years of flow data reveal is that the blend spans two distinct dimensions of community structure — economic capacity and residential continuity — which the national data show to be negatively related at the top of the advantage distribution. A place can be economically robust and residentially fluid; many of Australia’s most advantaged LGAs are exactly that. Treating the two as one number understates both. This series will return to the two-axis view in a subsequent piece.
Correction, October 2026. The APN Bedrock™ (24110) figures in this piece are restated on Bedrock methodology v1.1, which joins every Census figure to its locality by the ABS suburb code, reads unemployment for all persons and reads the SEIFA advantage and disadvantage index (IRSAD); each LGA reading is the population-weighted mean of its localities of more than 200 residents. Figure 2 is redrawn on that basis. The findings are unchanged.
Methodology Note
Bedrock findings cover the 532 of 547 LGAs with a Bedrock reading; Figures 1 and 3 plot the 541 LGAs with complete SEIFA, churn and density data, and per-figure samples are as stated in each caption. Population change is Estimated Resident Population, 30 June 2021 to 30 June 2025 (ABS Regional Population 2024–25, released March 2026). Churn is total internal and overseas arrivals plus departures over financial years 2021–22 to 2024–25 relative to population (ABS Regional Population components). Structural measures are 2021 Census and SEIFA 2021; the temporal ordering — structure measured before flows occurred — is what permits the predictive framing. All relationships are reported as full-sample correlations with r stated; correlation does not imply causation, and rate-based findings exclude or separately flag LGAs below 10,000 residents, where small-population volatility dominates. The Bedrock–IRSAD correlation across the full national sample is r = 0.80. IRSAD is itself one of the Bedrock composite’s five constituent pillars, and the tenure pillar’s relationship with churn is partly definitional, as noted above.


