
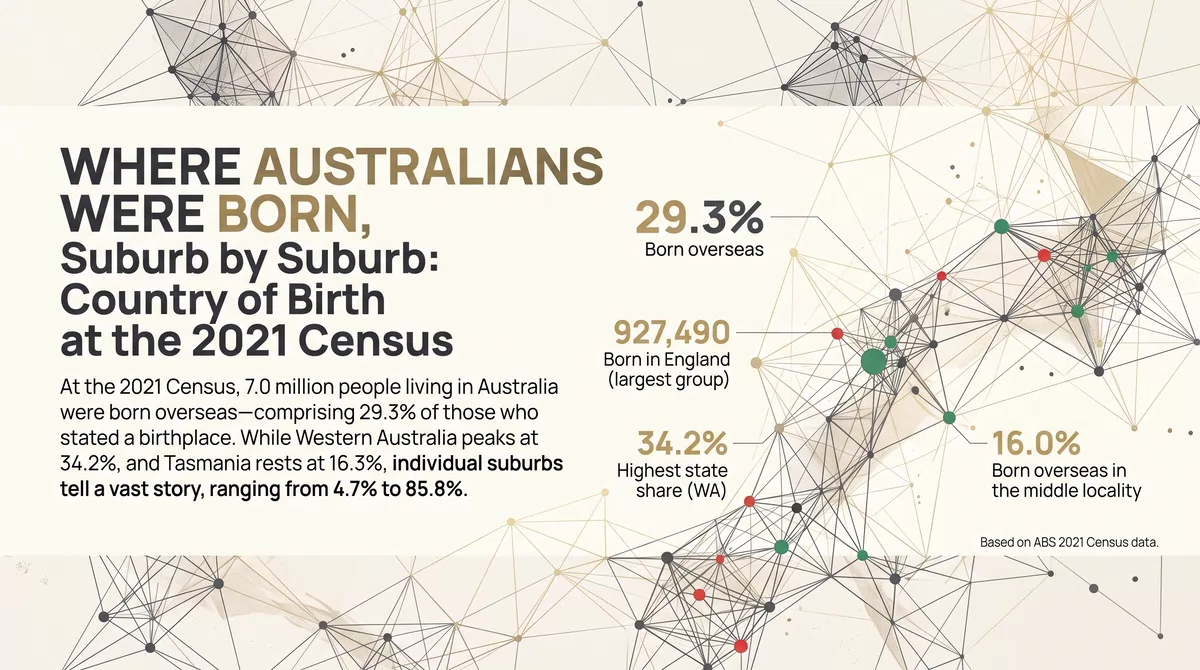

At the 2021 Census, 7.0 million people living in Australia had been born in another country: 29.3% of those who stated a birthplace. England, India, China and New Zealand were the four largest overseas birthplaces, and together with the Philippines they account for 42.2% of everyone born overseas. The share varies more between suburbs than between states. It ran from 16.3% in Tasmania to 34.2% in Western Australia, and among larger suburbs from 4.7% to 85.8%.
Country of birth is as stated at the Census of 10 August 2021.
What the Census asked
The Census asks every person in which country they were born. Table G09 of the Census General Community Profile reports the answers for Australia and for 49 other countries, with the remaining countries grouped together. Of the 25.4 million people counted, 17.0 million were born in Australia and 1.4 million, 5.3%, did not state a birthplace. The rates in this article are of those who did. On that basis 29.3% were born overseas; counted against everyone, including those who gave no answer, the figure is 27.7% on this count; the ABS publishes 27.6%.
Country of birth is a single fact about a person. It is not ancestry, citizenship or the language spoken at home, each of which the Census asks about separately. A child born in Australia to parents who were born overseas is counted as born in Australia.
The largest birthplaces
Ten largest overseas birthplaces, Australia, 2021 (thousands of people)
APN calculation based on Australian Bureau of Statistics data: Census of Population and Housing: General Community Profile, 2021, Table G09 (country of birth of person by age by sex). People born in each country, in thousands, with each country’s share of everyone who stated an overseas birthplace. Australia. China excludes the Special Administrative Regions and Taiwan. The table lists England, Scotland and Wales separately.
England is the largest overseas birthplace, with 927,490 people, followed by India (673,352), China (549,618) and New Zealand (530,492). The ten largest account for 55.1% of everyone born overseas, and 16 birthplaces each account for more than 100,000 people. Population growth since 2021, and the part that overseas arrivals have played in it, is set out in Births, Deaths and Arrivals: Where Australia’s Population Growth Comes From and Net Overseas Migration and the March Quarter.
By age
Share of people born overseas, by age group, 2021
APN calculation based on Australian Bureau of Statistics data: Census of Population and Housing: General Community Profile, 2021, Table G09 (country of birth of person by age by sex). Share of people who stated a country of birth. Australia, by age group in years.
The overseas-born share rises steeply with age through childhood and early adulthood. Of children under five, 2.8% were born overseas; of people aged 15 to 24, 20.2%; of those aged 25 to 44, 38.1%. In every age group from 25 upwards the share is above one-third. Part of the pattern follows from the definition: the Australian-born children of people who moved here are counted among the Australian-born.
By state and territory
Share of people born overseas, by state and territory, 2021
APN calculation based on Australian Bureau of Statistics data: Census of Population and Housing: General Community Profile, 2021, Table G09 (country of birth of person by age by sex). Share of people who stated a country of birth. The largest overseas birthplace in each state and territory is shown in brackets.
Western Australia had the highest share, 34.2%, followed by Victoria (31.6%) and New South Wales (31.0%). Tasmania had the lowest, 16.3%. The mix of birthplaces differs as much as the share does.
| State or territory | Born overseas | Largest overseas birthplace | Second | Third |
|---|---|---|---|---|
| Western Australia | 34.2% | England (196,885) | New Zealand (75,591) | India (61,088) |
| Victoria | 31.6% | India (258,193) | England (174,552) | China (171,447) |
| New South Wales | 31.0% | China (247,595) | England (231,385) | India (208,962) |
| Australian Capital Territory | 29.9% | India (17,203) | England (13,245) | China (12,149) |
| South Australia | 25.2% | England (95,248) | India (44,881) | China (25,709) |
| Queensland | 24.1% | New Zealand (208,572) | England (191,731) | India (71,819) |
| Northern Territory | 23.9% | Philippines (6,391) | England (5,053) | India (5,045) |
| Tasmania | 16.3% | England (19,283) | China (6,830) | Nepal (6,219) |
APN calculation based on Australian Bureau of Statistics data: Census of Population and Housing: General Community Profile, 2021, Table G09 (country of birth of person by age by sex). Share of people who stated a country of birth. Counts of people born in each country are as published by the ABS.
England is among the three largest overseas birthplaces in every state and territory, and the largest in Western Australia, South Australia and Tasmania. In Western Australia, people born in England are 7.9% of those who stated a birthplace. The largest group is China in New South Wales, India in Victoria and the Australian Capital Territory, New Zealand in Queensland (4.3% of those who stated a birthplace) and the Philippines in the Northern Territory.
By size of place
Share of people born overseas, by the size of the locality
APN calculation based on Australian Bureau of Statistics data: Census of Population and Housing: General Community Profile, 2021, Table G09 (country of birth of person by age by sex). Share of people who stated a country of birth. Localities are ABS Suburbs and Localities, grouped by their number of residents.
The overseas-born share rises with the size of the place. In localities with 201 to 999 residents it was 13.6%; in the 143 localities with 20,000 or more, 40.7%. Localities with 5,000 or more residents hold about 68% of the population. Taken together, the localities with 200 or fewer residents, which are not reported individually, had a share of about 11%.
How localities are spread
Number of localities by share of residents born overseas
APN calculation based on Australian Bureau of Statistics data: Census of Population and Housing: General Community Profile, 2021, Table G09 (country of birth of person by age by sex). The 6,951 localities with more than 200 residents, by the share of residents born overseas, with the share of residents living in each group.
Across the 6,951 localities with more than 200 residents, the middle locality had 16.0% of its residents born overseas, well below the national 29.3%. The difference reflects where people live: 63% of localities had a share under 20%, but those localities hold only 33% of residents. At the other end, in 254 localities at least half of residents were born overseas, and those localities are home to 3.1 million people.
The highest and lowest shares among larger suburbs
The lists below are limited to the 1,561 localities with at least 5,000 residents. In 193 of them, at least half of those who stated a birthplace were born overseas.
| Locality | State | Residents | Born overseas | Share of those who stated a birthplace |
|---|---|---|---|---|
| Haymarket | NSW | 8,305 | 6,500 | 85.8% |
| Harris Park | NSW | 5,043 | 3,758 | 79.6% |
| Sydney | NSW | 16,667 | 11,805 | 76.1% |
| Wolli Creek | NSW | 10,654 | 7,580 | 75.5% |
| Rhodes | NSW | 11,453 | 8,266 | 75.4% |
| Parramatta | NSW | 30,211 | 20,916 | 73.7% |
| Homebush West | NSW | 9,108 | 6,211 | 73.7% |
| Burwood | NSW | 18,224 | 12,602 | 73.4% |
| Westmead | NSW | 16,555 | 11,206 | 72.2% |
| Ultimo | NSW | 7,410 | 4,901 | 71.2% |
The ten highest are all in Sydney: the city centre and its neighbours Haymarket and Ultimo, and suburbs to its west and south, among them Parramatta, Harris Park, Westmead, Burwood, Rhodes and Wolli Creek. Of the fifty highest, 38 are in New South Wales, 11 in Victoria and one in Western Australia.
| Locality | State | Residents | Born overseas | Share of those who stated a birthplace |
|---|---|---|---|---|
| Forbes | NSW | 8,157 | 350 | 4.7% |
| Narrabri | NSW | 7,327 | 355 | 5.3% |
| Broken Hill | NSW | 17,706 | 909 | 5.6% |
| Kurri Kurri | NSW | 6,174 | 334 | 5.8% |
| Maiden Gully | Vic. | 5,407 | 310 | 5.9% |
| Casino | NSW | 10,930 | 598 | 6.1% |
| South Grafton | NSW | 6,288 | 345 | 6.1% |
| Gunnedah | NSW | 10,359 | 579 | 6.1% |
| Parkes | NSW | 11,324 | 675 | 6.4% |
| West Kempsey | NSW | 5,073 | 291 | 6.5% |
APN calculation based on Australian Bureau of Statistics data: Census of Population and Housing: General Community Profile, 2021, Table G09 (country of birth of person by age by sex). Share of people who stated a country of birth. Localities with at least 5,000 residents. Residents are as published by the ABS, which makes small random adjustments to protect confidentiality; the number born overseas is the total less those born in Australia and those who gave no birthplace.
The ten lowest are regional towns, nine in New South Wales and one, Maiden Gully, on the edge of Bendigo in Victoria. In each, fewer than one resident in fifteen who stated a birthplace was born overseas.
What this does not show
The figures show where people were born and where they lived on Census night. They do not say how long anyone has lived in Australia, their citizenship, their ancestry or the language they speak, and they carry no information about why people live where they do. The share who did not state a birthplace differs between places, from under 4% to more than 10% among the larger localities listed here, which is why rates are of those who answered. The Census was taken on 10 August 2021, seventeen months after Australia’s international border closed in March 2020, a period in which arrivals from overseas were reduced. Results from the August 2026 Census will update these figures.
- Australian Bureau of Statistics (Reference period: 2021) Census of Population and Housing: General Community Profile, table G09, by Suburbs and Localities, state and Australia [https://www.abs.gov.au/census/find-census-data/datapacks], ABS Website, accessed 10 October 2026.
ABS material is used under a Creative Commons Attribution 4.0 International licence. Calculations, standardisations and index readings are APN’s and are not attributable to the ABS.
Disclaimer
The analysis and information contained in this publication are for general informational and strategic purposes only and do not constitute financial, investment, legal, or any other form of professional advice. Australian Property Network is not a licensed financial advisor. Property values and market conditions can go up or down. Before making any property or investment decisions, you must conduct your own thorough research and seek independent professional advice tailored to your specific circumstances. Images are for illustrative purposes only. E.&O.E.
Findings are presented on the basis of data and evidence alone.
