Population growth in Australia remains concentrated in the capital cities. In the year to June 2025 the eight greater capital cities grew by 1.76% and the rest of the states by 1.08%; the capitals took 77% of national growth while holding 68% of the population. The capitals grow mainly through overseas migration, and Sydney and Melbourne lose residents to the rest of the country. In only one year since 2002, the year to June 2021, did the rest of the states grow faster than the capitals.
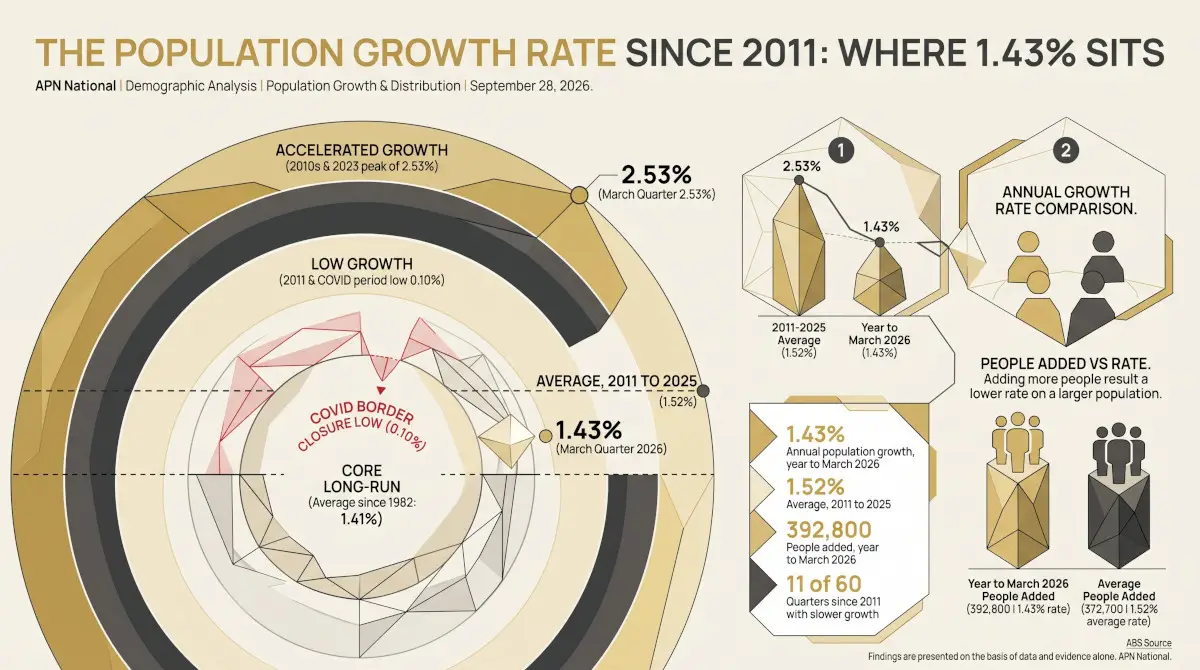
The node reading measures the size of Australia’s population against its 2011 to 2025 average and reads high largely because the population rises almost every quarter. This article is about where growth occurs.
Capitals and the rest
The Australian Bureau of Statistics (ABS) divides each state into a Greater Capital City Statistical Area, covering the capital and its surrounding commuting belt, and the rest of the state. The ACT is a single area. The figures here come from the ABS’s annual regional population estimates, the latest of which run to 30 June 2025. They are a year behind the quarterly state figures in Where Growth Lands, and were published before the ABS’s latest revision, so the national total for June 2025 here is about 12,000 higher than in the current quarterly series.
Capital against the rest, state by state
In the year to June 2025, the capital grew faster than the rest of its state or territory in six of the seven states and territories that have a rest-of-state area. Greater Perth grew fastest of the capitals, by 2.43%, against 1.40% in the rest of Western Australia. Greater Brisbane grew by 2.10% and the rest of Queensland by 1.42%, the fastest of any non-capital area. Greater Hobart was the exception: it grew by 0.21%, slower than the rest of Tasmania (0.30%) and the slowest of any capital.
Population growth, capital and rest of state, year to June 2025
Change in estimated resident population between 30 June 2024 and 30 June 2025. Source: ABS, Regional population, 2024–25.
Twenty-four years of concentration
The capitals held 65.0% of Australia’s population in 2001 and 67.9% in 2025, a share that rose every year except the year to June 2021. That year the capitals shrank by 0.27% while the rest of the states grew by 0.98%, the year the international borders were closed. The capitals then grew by 3.00% in the year to June 2023, their fastest in the period. Their share of national growth, highest at 83.7% in the year to June 2015, was 77.4% in 2025.
Population growth, greater capital cities and the rest of the states, 2002 to 2025
Growth over each year to 30 June, estimated resident population. Source: ABS, Regional population, 2024–25.
How each area grows
The capitals and the rest of the states grow in different ways. The capitals received 85% of net overseas migration in the year to June 2025. But six of the eight lost more residents to other parts of Australia than they gained, led by Greater Sydney (−33,282) and Greater Melbourne (−8,554); only Greater Brisbane (+11,077) and Greater Perth (+8,211) gained. The rest of every state except the Northern Territory gained from internal migration, though Tasmania’s gain was a single person; the largest were in Queensland (+10,518), New South Wales (+8,954) and Victoria (+7,777). In the rest of South Australia and the rest of Tasmania, deaths exceeded births.
Net internal migration by area, year to June 2025
Thousands of people. Moves in from other parts of Australia, less moves out, including moves within the same state. Source: ABS, Regional population, 2024–25.
| Area | Population, June 2025 | Growth 2024–25 | Average 2011–12 to 2024–25 | Natural increase | Net internal migration | Net overseas migration |
|---|---|---|---|---|---|---|
| Greater Sydney | 5,638,830 | 1.35% | 1.45% | 30,109 | −33,282 | 78,403 |
| Rest of NSW | 2,953,694 | 0.86% | 0.89% | 4,467 | 8,954 | 11,823 |
| Greater Melbourne | 5,435,590 | 1.97% | 1.92% | 32,416 | −8,554 | 81,168 |
| Rest of Victoria | 1,638,269 | 1.10% | 1.29% | 4,100 | 7,777 | 5,991 |
| Greater Brisbane | 2,833,524 | 2.10% | 2.00% | 13,212 | 11,077 | 33,934 |
| Rest of Queensland | 2,836,240 | 1.42% | 1.42% | 7,394 | 10,518 | 21,739 |
| Greater Adelaide | 1,491,015 | 1.27% | 1.19% | 3,248 | −2,425 | 17,824 |
| Rest of SA | 411,650 | 0.45% | 0.66% | −521 | 1,130 | 1,245 |
| Greater Perth | 2,452,765 | 2.43% | 2.10% | 12,588 | 8,211 | 37,289 |
| Rest of WA | 591,617 | 1.40% | 0.93% | 2,302 | 2,077 | 3,768 |
| Greater Hobart | 255,250 | 0.21% | 1.19% | 587 | −1,878 | 1,833 |
| Rest of Tasmania | 321,011 | 0.30% | 0.60% | −237 | 1 | 1,190 |
| Greater Darwin | 159,284 | 1.74% | 1.52% | 1,302 | −1,430 | 2,847 |
| Rest of NT | 105,272 | 0.91% | 0.22% | 722 | −675 | 906 |
| Australian Capital Territory | 484,630 | 1.30% | 1.99% | 2,882 | −1,501 | 4,819 |
Estimated resident population at 30 June; components over the year to 30 June 2025. Net internal migration includes moves between a capital and the rest of its own state as well as moves between states. Source: ABS, Regional population, 2024–25.
What this does not show
A greater capital city area includes outer suburbs and peri-urban towns within commuting range, and the rest of a state includes large regional cities as well as rural areas; growth within either can differ widely. The regional estimates for 2024–25 are preliminary. The components show where people came from, not why they moved, and no link to housing prices or rents is drawn here. The Demographic Analysis series carries the node readings.
Findings are presented on the basis of data and evidence alone.