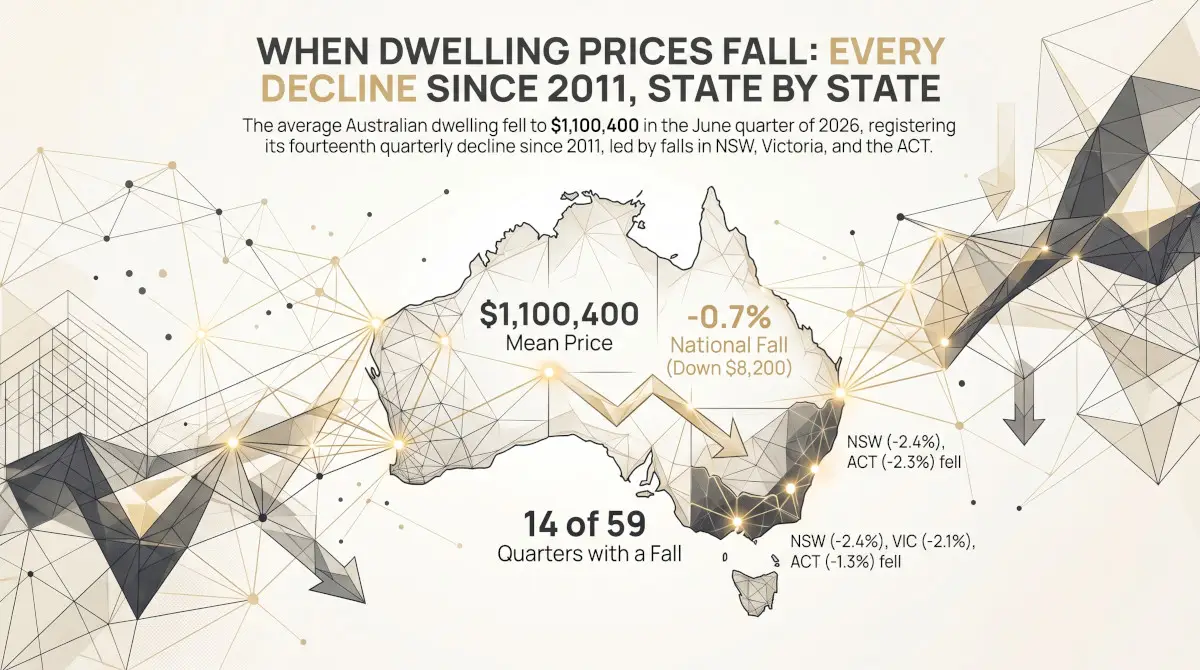

The average Australian dwelling was valued at $1,100,400 in the June quarter of 2026, $8,200 less than three months earlier. It was the fourteenth quarterly fall in the 59 quarters since the ABS measure began in 2011, and the largest since September 2022. The fall came from three places: New South Wales (−2.4%), Victoria (−2.1%) and the Australian Capital Territory (−1.3%). In the other five states and territories the average value was the highest in the ABS series.
The mean price is the ABS estimate of the average value of all dwellings, not of dwellings sold.
What the figure measures
Each quarter the ABS estimates the total value of Australia’s residential dwellings and divides it by the number of dwellings. The result, the mean price of residential dwellings, is the average value of every home in the country or in a state, whether or not it changed hands. It differs from a median sale price, which describes only the homes sold in a period. The series begins in the September quarter of 2011, is not seasonally adjusted, and its most recent quarters are revised as more sales information arrives. A fall in it is a fall in estimated value; an owner who does not sell realises no loss.
Fourteen falls in fifteen years
Quarterly change in the mean dwelling price, Australia, December quarter 2011 to June quarter 2026
APN calculation based on Australian Bureau of Statistics data: Total Value of Dwellings, June quarter 2026, Table 1 (A83728647F). Change in the mean price of residential dwellings, Australia, on the previous quarter, December quarter 2011 to June quarter 2026. Original series.
Nationally the mean price fell in 14 of the 59 quarters since 2011, about one in four. Half of the falls came in two episodes. From the March quarter of 2018 the mean price fell for five quarters in a row, ending 6.3% below its December 2017 level in March 2019; it passed that level again in March 2020. In 2022 it fell 4.3% in two quarters, including the largest single-quarter fall of the period, 3.3% in the September quarter, and passed its March 2022 level again in December 2023.
The June quarter of 2026 fall, 0.7%, is small beside those. It follows a rise of $42,300 in the December quarter of 2025, and the mean price remains 6.8% above its level a year earlier. One quarter in an unadjusted series is best read with the quarters around it.
The states have had very different declines
Deepest decline in the mean dwelling price since 2011, by state and territory (per cent fall from high to low)
APN calculation based on Australian Bureau of Statistics data: Total Value of Dwellings, June quarter 2026, Table 1 (A83728607L, A83728612F, A83728617T, A83728622K, A83728627W, A83728632R, A83728637A, A83728642V, A83728647F). The largest fall in the mean price of residential dwellings from an earlier high to a later low, September quarter 2011 to June quarter 2026, with the quarters of the high and the low.
The national figure conceals wide differences. In Western Australia the mean price fell 15.7% between June 2014 and June 2020, a decline lasting six years, and did not pass its 2014 level until September 2021. The Northern Territory’s fell 21.5% over a similar period and passed its earlier level in March 2022. New South Wales and Victoria had their deepest declines in 2017 to 2019, of 9.0% and 8.6%.
Queensland and South Australia have had nothing comparable. Queensland’s deepest decline since 2011 was 3.3%, over two quarters in 2022, and South Australia’s was 2.3%, in 2012. Tasmania and the Australian Capital Territory had shallower but long declines after the 2021–22 peak: each took until December 2025, close to four years, to pass its earlier high.
| Mean price, June 2026 | Change in the quarter | Quarters with a fall | Deepest decline | From peak to low | Earlier peak passed | Variability of quarterly change (points) | |
|---|---|---|---|---|---|---|---|
| New South Wales | $1,304,900 | −2.4% | 18 of 59 | −9.0% | June 2017 to March 2019 | September 2020 | 2.6 |
| Victoria | $918,400 | −2.1% | 18 of 59 | −8.6% | December 2017 to March 2019 | December 2019 | 2.2 |
| Queensland | $1,130,600 | 1.4% | 9 of 59 | −3.3% | June 2022 to December 2022 | June 2023 | 2.2 |
| South Australia | $979,600 | 1.4% | 14 of 59 | −2.3% | December 2011 to September 2012 | December 2013 | 2.0 |
| Western Australia | $1,123,700 | 2.2% | 21 of 59 | −15.7% | June 2014 to June 2020 | September 2021 | 2.7 |
| Tasmania | $733,200 | 2.2% | 17 of 59 | −6.8% | March 2022 to September 2024 | December 2025 | 2.9 |
| Northern Territory | $614,400 | 4.4% | 27 of 59 | −21.5% | June 2014 to December 2019 | March 2022 | 4.0 |
| Australian Capital Territory | $981,700 | −1.3% | 22 of 59 | −6.0% | December 2021 to March 2025 | December 2025 | 2.8 |
| Australia | $1,100,400 | −0.7% | 14 of 59 | −6.3% | December 2017 to March 2019 | March 2020 | 1.9 |
APN calculation based on Australian Bureau of Statistics data: Total Value of Dwellings, June quarter 2026, Table 1 (A83728607L, A83728612F, A83728617T, A83728622K, A83728627W, A83728632R, A83728637A, A83728642V, A83728647F). Variability is the standard deviation of the quarterly percentage change over the 59 quarters. “Earlier peak passed” is the first quarter in which the mean price exceeded the high from which the decline began.
How often prices fall
Quarters in which the mean dwelling price fell, of 59, by state and territory
APN calculation based on Australian Bureau of Statistics data: Total Value of Dwellings, June quarter 2026, Table 1 (A83728607L, A83728612F, A83728617T, A83728622K, A83728627W, A83728632R, A83728637A, A83728642V, A83728647F). Number of quarters, of the 59 from December 2011 to June 2026, in which the mean price was lower than in the previous quarter.
Queensland’s mean price fell in 9 quarters of the 59, the fewest of any state, and the Northern Territory’s in 27, close to half. Every state’s mean price moves more from quarter to quarter than the national figure, which averages them: the variability of quarterly change is 1.9 percentage points nationally, between 2.0 (South Australia) and 4.0 (the Northern Territory) across the states and territories. The two territories and Tasmania have small dwelling stocks, and their estimates move more for that reason. In only two quarters, March 2019 and September 2022, did the mean price fall in all eight states and territories at once.
The June quarter of 2026
Change in the mean dwelling price, March quarter to June quarter 2026
APN calculation based on Australian Bureau of Statistics data: Total Value of Dwellings, June quarter 2026, Table 1 (A83728607L, A83728612F, A83728617T, A83728622K, A83728627W, A83728632R, A83728637A, A83728642V, A83728647F). Change in the mean price of residential dwellings between the March and June quarters of 2026. Original series; the June quarter is the first estimate and is open to revision.
The June quarter split the country. The mean price rose in Western Australia, Queensland, South Australia, Tasmania and the Northern Territory, in each case to the highest value in the series. Over the year to June it rose 22.9% in Western Australia and 15.4% in Queensland.
In New South Wales the 2.4% fall was the largest since September 2022, from a series high in March. Victoria and the Australian Capital Territory each fell for a second quarter and stood 3.6% and 2.6% below their December 2025 highs. Victoria’s mean price, $918,400, was level with a year earlier and below its March 2022 value of $942,200. Because New South Wales and Victoria hold more than half of the value of Australia’s dwellings, their falls outweighed the rises elsewhere in the national mean. A companion article sets each state’s mean price against local earnings.
Where the volatility reading sits
Price Volatility & Risk Assessment (21630) combines the size of the latest quarterly move in the national mean price, in either direction, with how much that price has varied over the previous two years, and sets the result against the number of new home loans being written. In the June quarter of 2026 it read −0.3402σ, a little below its average since 2013, and ranked 44.2 against 53 quarters: higher than 23 of the other 52. On that measure the June quarter’s fall was an ordinary-sized move. The measure treats rises and falls alike, and the larger move of recent quarters was the rise in the December quarter of 2025.
What this does not show
These are averages of estimated values across all dwellings, so they say nothing about any one home, suburb or type of dwelling, and a state average can be steady while parts of it move sharply. The figures are in current dollars, and a price that holds its level while consumer prices rise has fallen in real terms; an earlier article covers national prices after inflation. The history here begins in 2011 and so holds only the declines of the past fifteen years. The June quarter estimate is the first for that quarter and may be revised. Nothing in the history of past declines indicates what the next quarter will bring.
- Australian Bureau of Statistics (Reference period: June quarter 2026) ‘Table 1. Total Value of Dwellings, All Series’ [data set], Total Value of Dwellings, Australia [https://www.abs.gov.au/statistics/economy/price-indexes-and-inflation/total-value-dwellings/jun-quarter-2026], accessed 10 October 2026.
ABS material is used under a Creative Commons Attribution 4.0 International licence. Calculations, standardisations and index readings are APN’s and are not attributable to the ABS.
Findings are presented on the basis of data and evidence alone.