
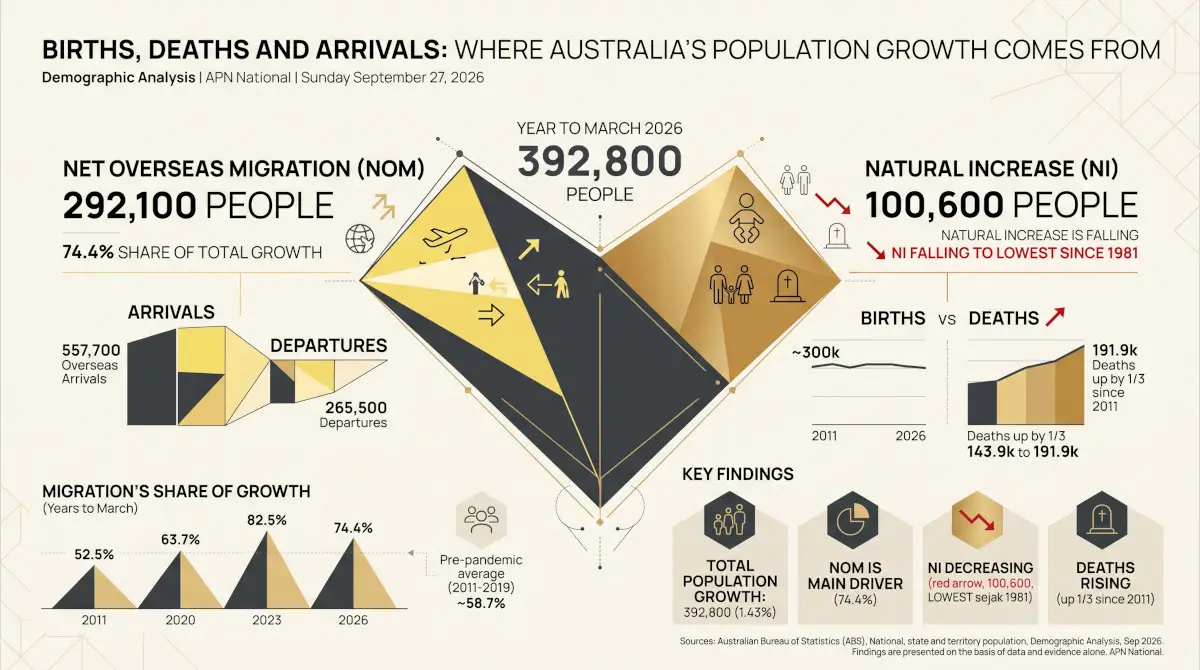

Australia’s population grew by 392,800 people in the year to March 2026. About three in every four of them, 292,100, came from net overseas migration; the other 100,600 came from births exceeding deaths. Before the pandemic the split was nearer three in five. The shift is not only a story about migration: births have held near 300,000 a year for fifteen years while deaths have risen by a third, so natural increase is now at its lowest since the series began in 1981, about 100,600 a year against roughly 150,000 to 160,000 in the early 2010s.
The node reading measures the size of the population against its 2011 to 2025 average. Because the population rises almost every quarter, it reads high largely because time has passed; this article is about how growth is made up, not how large the population is.
Two sources of growth
Australia’s population grows in two ways. Natural increase is births minus deaths. Net overseas migration is the number of people arriving to live in Australia for a year or more, less the number leaving for a year or more; it counts anyone who comes to live in Australia or leaves it, regardless of nationality, citizenship or visa, including returning Australians, students and temporary workers, not only permanent migrants. The Australian Bureau of Statistics (ABS) estimates both every quarter. Both are original series, and the migration count in particular moves with the seasons, so this piece compares full years to March.
The quarterly pattern of migration, and how the latest figures compare with their longer-run norm, are covered in Net Overseas Migration and the March Quarter and Where the Pressure Isn’t. This piece is about the split: how much of each year’s growth came from each source.
The split, year by year
In the year to March 2026 the population grew by 392,800, or 1.43%. Net overseas migration contributed 292,100 and natural increase 100,600.
Population growth by source, years to March 2011 to 2026
Thousands of people. Bars: natural increase and net overseas migration. Black line: the change in the estimated resident population. Source: ABS, National, state and territory population, March 2026, Table 1.
From 2011 to 2019 the pattern was steady: net overseas migration averaged about 217,500 a year and natural increase about 153,000. The border closures reversed migration: in the year to March 2021 more people left than arrived, by 94,400, and the population grew by only 25,100. Net overseas migration then rebounded to 495,800 in the year to March 2023, the highest in the period, and has since eased to 292,100.
Up to the year to March 2022 the two components do not add exactly to the change in the population, by up to 25,500 a year. For years before the latest Census, the ABS’s population series also includes what it calls intercensal difference: the gap between the population counted at the Census and the one built up from quarterly births, deaths and migration, which it says cannot generally be attributed to any one source. The shares in this piece are computed from the two components alone.
Why natural increase is falling
The number of births has barely moved: 292,400 in the year to March 2026, against 300,800 in the year to March 2011, and between 289,800 and 311,800 in every year between. Deaths have risen over the period, from 143,900 to 191,900, about a third higher. The gap between the two, natural increase, has fallen in 11 of the last 13 years.
Births, deaths and natural increase, years to March 2011 to 2026
Thousands of people. Natural increase is births minus deaths. Source: ABS, National, state and territory population, March 2026, Table 1.
Deaths tend to rise as a population grows and ages. How births relate to fertility rates and the age of mothers is a separate question, not covered here.
Migration’s share of growth
Net overseas migration supplied between 52% and 64% of each year’s growth from 2011 to 2020, and 58.7% across the years to March 2011 to 2019 combined. Its share rose to 82.5% in the year to March 2023, and was 74.4% in the year to March 2026.
Share of population growth from net overseas migration, years to March
Net overseas migration as a percentage of natural increase plus net overseas migration; the 2011 to 2019 average is 58.7%. The year to March 2021 is omitted: net overseas migration was negative, so a share is not meaningful. Source: ABS, National, state and territory population, March 2026, Table 1.
Part of that rise comes from the smaller denominator rather than the larger migration count. Had natural increase in the latest year matched its 2011–2019 average of 153,000, the same migration would have made up about 66% of growth rather than 74%.
| Year to March | Births | Deaths | Natural increase | Net overseas migration | Change in population | Growth rate | Share from migration |
|---|---|---|---|---|---|---|---|
| 2011 | 300,800 | 143,900 | 157,000 | 173,200 | 304,700 | 1.39% | 52.5% |
| 2012 | 304,800 | 147,200 | 157,900 | 219,200 | 372,100 | 1.67% | 58.1% |
| 2013 | 311,500 | 149,300 | 162,200 | 237,400 | 402,100 | 1.78% | 59.4% |
| 2014 | 307,200 | 148,900 | 158,400 | 202,200 | 363,200 | 1.58% | 56.1% |
| 2015 | 309,200 | 154,900 | 154,200 | 181,200 | 339,400 | 1.45% | 54.0% |
| 2016 | 308,900 | 157,700 | 151,300 | 196,000 | 357,800 | 1.51% | 56.4% |
| 2017 | 309,700 | 159,300 | 150,400 | 259,700 | 408,000 | 1.69% | 63.3% |
| 2018 | 305,000 | 162,700 | 142,300 | 237,900 | 370,400 | 1.51% | 62.6% |
| 2019 | 304,200 | 160,600 | 143,700 | 250,700 | 383,100 | 1.54% | 63.6% |
| 2020 | 302,100 | 165,700 | 136,500 | 239,200 | 363,000 | 1.44% | 63.7% |
| 2021 | 299,300 | 162,800 | 136,400 | −94,400 | 25,100 | 0.10% | — |
| 2022 | 311,800 | 178,200 | 133,600 | 131,000 | 260,000 | 1.01% | 49.5% |
| 2023 | 294,700 | 189,200 | 105,500 | 495,800 | 601,300 | 2.32% | 82.5% |
| 2024 | 289,800 | 184,400 | 105,400 | 493,900 | 599,200 | 2.26% | 82.4% |
| 2025 | 291,500 | 186,000 | 105,400 | 309,400 | 414,900 | 1.53% | 74.6% |
| 2026 | 292,400 | 191,900 | 100,600 | 292,100 | 392,800 | 1.43% | 74.4% |
People, rounded to the nearest hundred as published. Share from migration is net overseas migration as a percentage of natural increase plus net overseas migration; it is not shown for the year to March 2021, when net overseas migration was negative. Source: ABS, National, state and territory population, March 2026, Table 1.
What this does not show
The components describe where the population change came from, not why. They say nothing about how new residents are housed, and no link to prices or rents is drawn here. Net overseas migration is itself a balance of much larger flows in both directions: in the year to March 2026 it was the difference between about 557,700 overseas arrivals and 265,500 departures, and a small change in either can move it materially. The most recent quarters are preliminary: the ABS moves each quarter from preliminary to revised to final as fuller component data arrive. The Demographic Analysis series carries the node readings, and the economy against its fifteen-year averages sets population growth beside other measures.
Findings are presented on the basis of data and evidence alone.

