Western Australia’s population grew fastest in the year to March 2026, by 2.12%, and Tasmania’s slowest, by 0.59%. Only Western Australia and the Northern Territory grew faster than their own averages since 2011. Overseas migration was the largest source of growth in every state, while moves between states split them: New South Wales lost 20,818 people to the rest of the country and Queensland gained 14,718, its smallest gain since 2016.
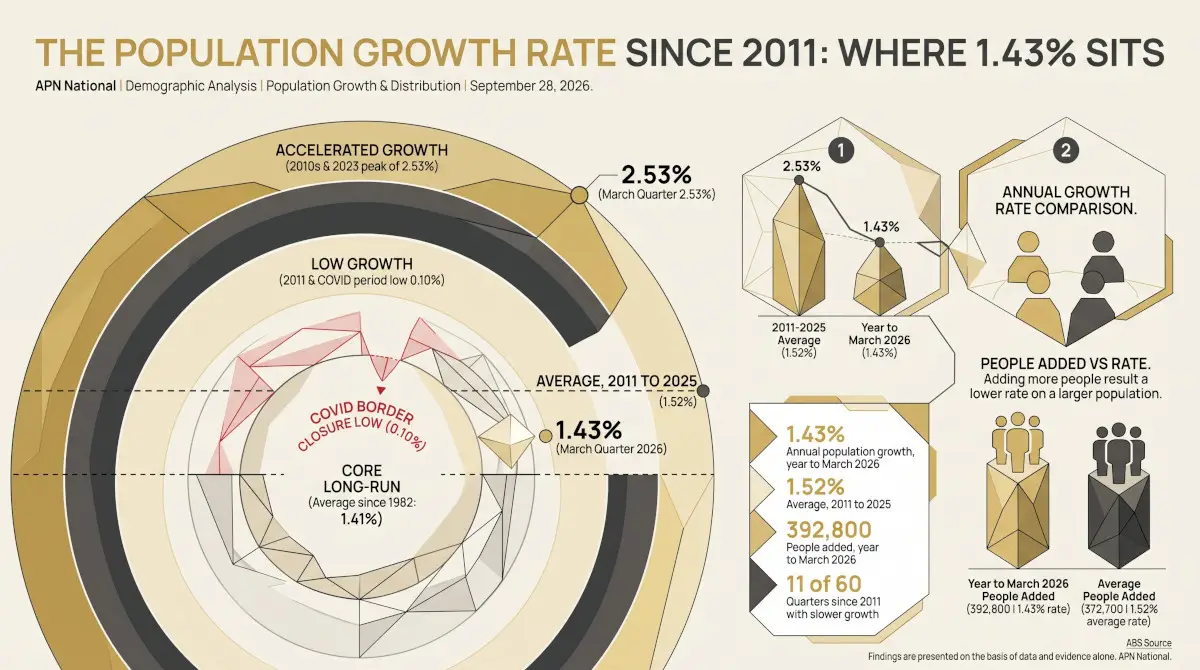
The node reading measures the size of Australia’s population against its 2011 to 2025 average, and reads high largely because the population rises almost every quarter. This article is about growth rates and their sources.
Three sources of growth
A state’s population changes in three ways: natural increase (births minus deaths), net overseas migration (people arriving from overseas to live for a year or more, less those leaving), and net interstate migration (people moving in from other states and territories, less those moving out). Interstate moves cancel out nationally, so they reshape where Australians live without changing how many there are. The figures are the Australian Bureau of Statistics’ (ABS) quarterly estimates, summed over the year to March 2026. How national growth compares with its own history is covered in The Population Growth Rate Since 2011.
Who grew fastest
Western Australia grew by 2.12% in the year to March 2026, followed by Queensland (1.59%), Victoria (1.55%) and the Northern Territory (1.51%). Tasmania grew by 0.59% and South Australia by 0.97%. Against each jurisdiction’s own average from 2011 to 2025, only Western Australia and the Northern Territory grew faster; the ACT, whose average of 1.97% is the highest of any jurisdiction, grew by 1.28%.
Population growth by state and territory, year to March 2026
Change in estimated resident population over the four quarters to March 2026, with each jurisdiction’s average annual growth from March 2011 to December 2025 in brackets. Source: ABS, National, state and territory population, March 2026.
Where the growth came from
Net overseas migration added more people than natural increase in every state and territory. Interstate migration moved people from New South Wales (−20,818), the Northern Territory (−1,589), the ACT (−1,401) and South Australia (−1,208) to Queensland (+14,718) and Western Australia (+10,314). Victoria’s interstate balance was close to zero, at +82, and Tasmania’s at −98.
Sources of population change by state and territory, year to March 2026
Thousands of people. Bars above the line add to population; bars below subtract. Grey line: the change in estimated resident population. Source: ABS, National, state and territory population, March 2026.
| Jurisdiction | Growth, year to March 2026 | Average, 2011 to 2025 | People added | Natural increase | Net overseas migration | Net interstate migration |
|---|---|---|---|---|---|---|
| Western Australia | 2.12% | 1.92% | 64,200 | 12,300 | 41,600 | 10,314 |
| Queensland | 1.59% | 1.70% | 90,100 | 20,300 | 55,200 | 14,718 |
| Victoria | 1.55% | 1.74% | 109,500 | 27,800 | 81,700 | 82 |
| Northern Territory | 1.51% | 0.99% | 4,000 | 2,000 | 3,600 | −1,589 |
| Australian Capital Territory | 1.28% | 1.97% | 6,200 | 2,700 | 4,900 | −1,401 |
| New South Wales | 1.13% | 1.24% | 97,000 | 33,200 | 84,600 | −20,818 |
| South Australia | 0.97% | 1.05% | 18,400 | 2,300 | 17,500 | −1,208 |
| Tasmania | 0.59% | 0.85% | 3,400 | 300 | 3,200 | −98 |
| Australia | 1.43% | 1.52% | 392,800 | 100,600 | 292,100 | 0 |
Estimated resident population, original. Natural increase and net overseas migration are published in thousands to one decimal place; net interstate migration in persons; so the three may differ from the change in population by a few hundred. People added is the difference between the published estimates, which are in thousands; the ABS reports Australia’s growth over the year as 392,700. Australia includes the Other Territories. Source: ABS, National, state and territory population, March 2026.
Moves between states since 2012
New South Wales has lost people to other states in every year to March since 2012, most in the year to March 2023 (−31,662), and Queensland has gained in every year, most in the year to March 2022 (+40,057). Queensland’s gain has since narrowed to 14,718, the smallest since 2016. Victoria gained from other states in every year to March until 2020, lost 29,986 and 33,728 in the years to March 2021 and 2022, smaller numbers in each year to March 2025, and is now roughly balanced. Western Australia lost people interstate in each year to March from 2014 to 2020 and has gained in every year since.
Net interstate migration, years to March 2012 to 2026
Thousands of people. The four largest states by interstate movement; Queensland and Western Australia dashed. Source: ABS, National, state and territory population, March 2026.
What this does not show
These are state totals; growth within each state differs between capital cities and regions. The ACT and the Northern Territory have small populations, so a change of a few thousand people moves their growth rates noticeably. The most recent quarters are preliminary and are revised as fuller data arrive. The components say where population change came from, not why people moved, and no link to housing prices or rents is drawn here. The national split between births, deaths and migration is set out in Births, Deaths and Arrivals, and the Demographic Analysis series carries the node readings.
Findings are presented on the basis of data and evidence alone.