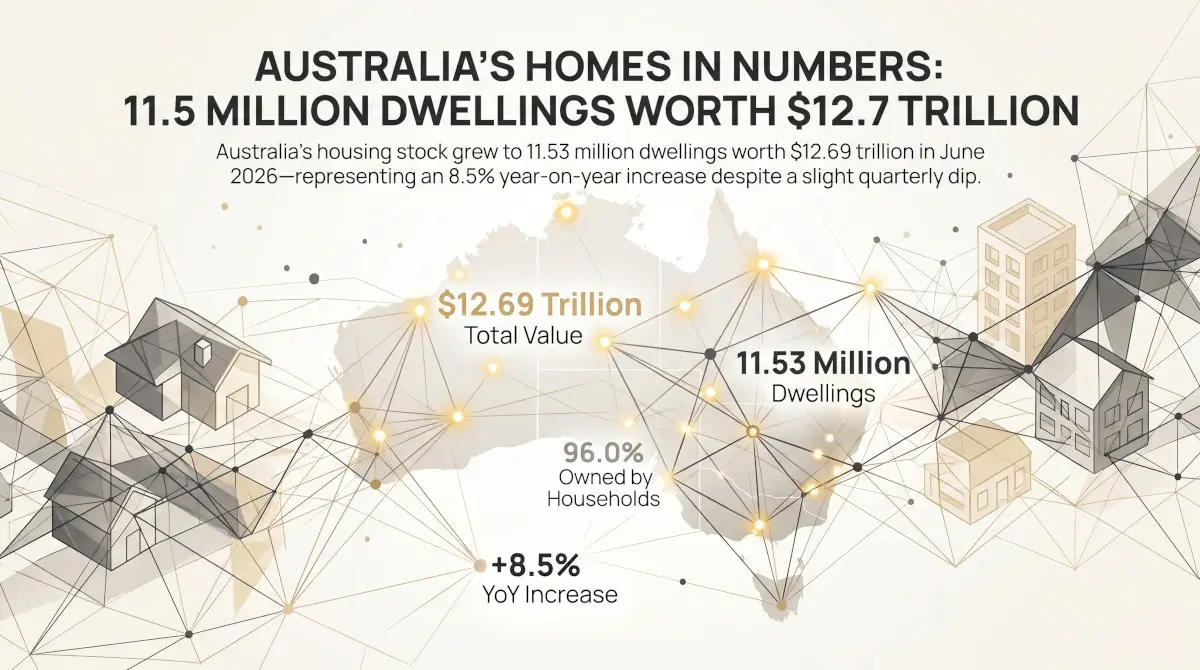

Australia had 11.53 million residential dwellings at the June quarter of 2026, and the ABS put their combined value at $12.69 trillion. That is $992bn more than a year earlier and close to three times the $4.42 trillion of September 2011, when the series begins. It is also $34bn less than in the March quarter: the first quarterly fall in the total since 2022. Households own 96.0% of it, and more than a third of the value is in New South Wales.
ABS estimates of the value of every residential dwelling, whether or not it was sold. Current dollars.
What is being counted
Each quarter the ABS estimates the value of every residential dwelling in Australia, houses and apartments, occupied or not, sold or not, and adds them up. The total is the value of the housing stock: land and buildings together, in current dollars. Dividing it by the number of dwellings gives the mean dwelling price, which was $1,100,400 in the June quarter. These are estimates built from sales and other information, and the ABS revises recent quarters as more sales are recorded.
The total: $12.69 trillion, just below its high
Total value of residential dwellings, Australia
APN chart based on Australian Bureau of Statistics data: Total Value of Dwellings, June quarter 2026, Table 1 (A83728646C). $ trillion, value of the dwelling stock owned by all sectors, September quarter 2011 to June quarter 2026, current prices.
The total value passed $5 trillion in the March quarter of 2014, $10 trillion in the March quarter of 2022 and $12 trillion in the December quarter of 2025. It reached $12.72 trillion in the March quarter of 2026 and was $12.69 trillion in June, a fall of 0.3%. The total has fallen in 10 of the 59 quarters since 2011; the last falls before this one were in the June and September quarters of 2022.
Over the year to June the total rose 8.5%, or $992bn. Most of that came from higher values, not more homes. The number of dwellings rose by 173,600 over the year. Valued at the average price of a year earlier, those additional dwellings account for about $179bn of the increase, a little under a fifth; the rest is the change in the value of the existing stock.
More homes, and dearer ones
Since September 2011 the number of dwellings has grown 28.1%, from 9.00 million to 11.53 million, while the mean price has risen 124%. The two together account for the near-tripling of the total. The number of dwellings has grown fastest in the Australian Capital Territory (42.7%) and Victoria (34.3%) and slowest in South Australia (17.2%).
Who owns it
The ABS divides the stock between dwellings owned by households and those owned by others, which it labels non-households. Households owned 96.0% of the value in June 2026, $12.18 trillion, and non-households $506bn. The household share was 94.7% in 2011.
Where the value is held
Share of the national value of dwellings, by state and territory, June quarter 2026
APN calculation based on Australian Bureau of Statistics data: Total Value of Dwellings, June quarter 2026, Table 1. Each state’s share of the national value of dwellings at the June quarter 2026, with its share of the number of dwellings.
New South Wales holds 36.5% of the value with 30.8% of the dwellings. Victoria is the reverse: 26.4% of the dwellings and 22.0% of the value. In 2011 Victoria held 26.3% of the national value and Queensland 17.3%; Queensland now holds 20.7%, and its housing stock, at $2,623bn, is worth nearly as much as Victoria’s $2,795bn although Victoria has about 720,000 more dwellings. Three states hold a larger share of the value than of the dwellings: New South Wales, Queensland and Western Australia.
| Dwellings | Total value | Mean price | Share of national value | Share of dwellings | Change in value over the year | |
|---|---|---|---|---|---|---|
| New South Wales | 3,550,300 | $4,633bn | $1,304,900 | 36.5% | 30.8% | +3.4% |
| Victoria | 3,043,000 | $2,795bn | $918,400 | 22.0% | 26.4% | +1.8% |
| Queensland | 2,319,900 | $2,623bn | $1,130,600 | 20.7% | 20.1% | +17.2% |
| South Australia | 846,500 | $829bn | $979,600 | 6.5% | 7.3% | +14.3% |
| Western Australia | 1,203,200 | $1,352bn | $1,123,700 | 10.7% | 10.4% | +24.6% |
| Tasmania | 270,300 | $198bn | $733,200 | 1.6% | 2.3% | +9.9% |
| Northern Territory | 91,100 | $56bn | $614,400 | 0.4% | 0.8% | +15.8% |
| Australian Capital Territory | 206,800 | $203bn | $981,700 | 1.6% | 1.8% | +5.2% |
| Australia | 11,531,100 | $12,689bn | $1,100,400 | 100.0% | 100.0% | +8.5% |
APN calculation based on Australian Bureau of Statistics data: Total Value of Dwellings, June quarter 2026, Table 1. Number of residential dwellings, value of the dwelling stock owned by all sectors and mean price, June quarter 2026. Shares and changes are APN calculations.
The past year by state
Change in the total value of dwellings over the year to the June quarter 2026
APN calculation based on Australian Bureau of Statistics data: Total Value of Dwellings, June quarter 2026, Table 1. Change in the total value of dwellings between the June quarter 2025 and the June quarter 2026, with the dollar amount added. Current prices.
The value of the stock rose over the year in every state and territory, and by very different amounts: 24.6% in Western Australia, 17.2% in Queensland and 15.8% in the Northern Territory, against 3.4% in New South Wales and 1.8% in Victoria. Queensland added the most in dollars, $385bn. In the June quarter itself the total fell in New South Wales, Victoria and the Australian Capital Territory and rose in the other five.
What this does not show
The total is an estimate of what every dwelling would be worth, not a sum of sales, and only a small share of dwellings sells in any quarter. It is in current dollars and is not adjusted for inflation. It counts the value of homes and not the debt secured against them, so it is not a measure of household wealth. The household and non-household split says nothing about how many dwellings any one owner holds. The June quarter figures are first estimates.
- Australian Bureau of Statistics (Reference period: June quarter 2026) ‘Table 1. Total Value of Dwellings, All Series’ [data set], Total Value of Dwellings, Australia [https://www.abs.gov.au/statistics/economy/price-indexes-and-inflation/total-value-dwellings/jun-quarter-2026], accessed 10 October 2026.
ABS material is used under a Creative Commons Attribution 4.0 International licence. Calculations, standardisations and index readings are APN’s and are not attributable to the ABS.
Findings are presented on the basis of data and evidence alone.