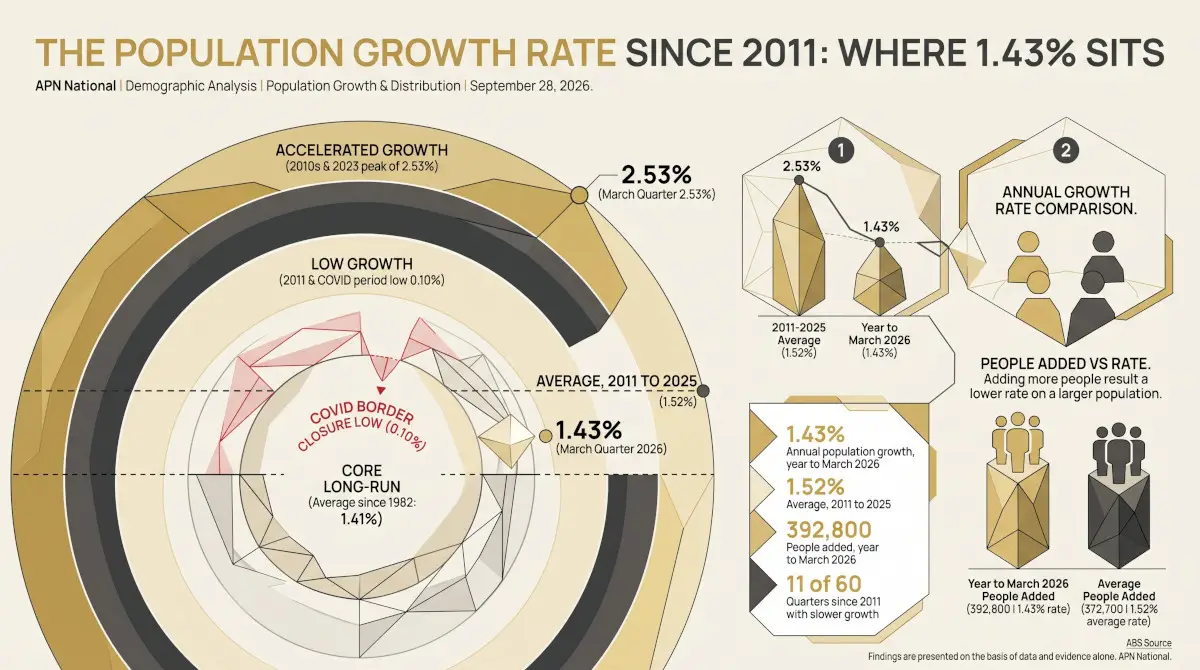

Australia’s population grew by 1.43% in the year to March 2026, adding 392,800 people. That is below the average of 1.52% a year since 2011, and lower than in all but 11 of the 60 quarters from 2011 to 2025, every one of them from the border closures or the first half of 2011. It is close to the long-run average since 1982 of 1.41%. Growth has eased almost every quarter since its peak of 2.53% in 2023.
The node reading measures the size of the population against its 2011 to 2025 average. Because the population rises almost every quarter, it reads high largely because time has passed. The growth rate, the subject of this article, is the measure of how fast the population is changing.
Size and speed
Australia’s estimated resident population reached 27,921,200 at the end of March 2026. A population’s size and the speed at which it changes are different measures. The size rises almost every quarter, so it reaches a new high almost every quarter too, which says little about whether growth is unusual. The annual growth rate, the change over the past four quarters as a share of the population a year earlier, is the measure that shows whether the population is growing faster or slower than before. The growth rate is used throughout this piece.
Where 1.43% sits
In the year to March 2026 the population grew by 1.43%. Across the 60 quarters from March 2011 to December 2025 the annual rate averaged 1.52%, and it was lower than 1.43% in only 11 of them: the years to March and June 2011, and nine quarters from mid-2020 to mid-2022, the period of the border closures and the months after they lifted. Before the pandemic, from 2011 to 2019, it ranged between 1.39% and 1.80% and averaged 1.57%.
Annual population growth, 2011 to 2026
Growth over the four quarters to each quarter end, estimated resident population, original. Dotted line: the average from March 2011 to December 2025. Source: ABS, National, state and territory population, March 2026, Table 1.
The low point was 0.10% in the year to March 2021, when more people left the country than arrived. After the borders reopened, growth rose to 2.53% in the year to September 2023, the highest in the period. It has eased in every quarter since, except the September quarter of 2025, and is now below its pre-pandemic average of 1.57%. The sources of that growth, births, deaths and migration, are set out in Births, Deaths and Arrivals.
More people, a lower rate
The 392,800 people added in the latest year are more than the average of 372,700 a year since 2011, even though the rate is below its average. The two are consistent: the same number of people is a smaller share of a larger population. Adding the 2011–2025 average number of people to the population of March 2025 would have been growth of 1.35%.
People added to the population over the year, 2011 to 2026
Thousands of people, change over the four quarters to each quarter end. Dotted line: the average from March 2011 to December 2025. Source: ABS, National, state and territory population, March 2026, Table 1.
| Year to March | Population at March | People added | Growth rate |
|---|---|---|---|
| 2011 | 22,268,800 | 304,700 | 1.39% |
| 2012 | 22,640,900 | 372,100 | 1.67% |
| 2013 | 23,043,000 | 402,100 | 1.78% |
| 2014 | 23,406,200 | 363,200 | 1.58% |
| 2015 | 23,745,600 | 339,400 | 1.45% |
| 2016 | 24,103,400 | 357,800 | 1.51% |
| 2017 | 24,511,400 | 408,000 | 1.69% |
| 2018 | 24,881,800 | 370,400 | 1.51% |
| 2019 | 25,264,900 | 383,100 | 1.54% |
| 2020 | 25,627,900 | 363,000 | 1.44% |
| 2021 | 25,653,000 | 25,100 | 0.10% |
| 2022 | 25,913,000 | 260,000 | 1.01% |
| 2023 | 26,514,300 | 601,300 | 2.32% |
| 2024 | 27,113,500 | 599,200 | 2.26% |
| 2025 | 27,528,400 | 414,900 | 1.53% |
| 2026 | 27,921,200 | 392,800 | 1.43% |
Estimated resident population, original. Source: ABS, National, state and territory population, March 2026, Table 1.
The longer view
The ABS series runs back to 1981. Since 1982 annual growth has averaged 1.41%, and it has been at or above 1.43% in 89 of 175 quarters, about half. Measured against that longer history, the current rate is close to typical; it is against the faster growth of the 2010s that it reads as low.
Annual population growth, 1982 to 2026
Growth over the four quarters to each quarter end, estimated resident population, original. Dotted line: the average from June 1982 to December 2025. Source: ABS, National, state and territory population, March 2026, Table 1.
What this does not show
The growth rate is a national figure; growth differs between states and between cities and regions. The latest quarters are preliminary and are revised as fuller migration and registration data arrive. How the migration part of growth compares with its own norm is covered in Where the Pressure Isn’t and its seasonal pattern in Net Overseas Migration and the March Quarter. No link between population growth and housing prices or rents is drawn here. The Demographic Analysis series carries the node readings.
Findings are presented on the basis of data and evidence alone.