The Australian Bureau of Statistics’ population projections have missed on both sides in the past decade. By June 2025 Australia’s population was 369,000 below the medium series of the 2017-based projections, and below even their low series in every year from 2018. It was 207,000 above the medium series of the 2022-based projections, and above even their high series from 2023. Projections are not forecasts: they show what would happen if particular assumptions held, and net overseas migration, which swung from −85,000 in the year to June 2021 to 538,300 two years later, moved further than either edition assumed.
The node reading measures the size of Australia’s population against its 2011 to 2025 average. No reading is published for the projections.
What a projection is
The ABS publishes a new edition of its population projections after each Census, starting from the estimated population at 30 June of a base year. Each series combines an assumption about fertility, one about life expectancy and one about net overseas migration, and the projection shows the population that would result if those assumptions held. They describe what would happen under stated assumptions; they are not forecasts, and none of the series is presented as the expected outcome. This piece compares two editions with what happened: the 2017-based projections (base year 2017, published in 2018) and the 2022-based projections (base year 2022, published in 2023). It uses the ABS’s three main series: Series A (high fertility, high life expectancy, high migration), Series B (medium on all three) and Series C (low fertility, medium life expectancy, low migration).
Both editions start close to the population as it is now estimated: the 2017 base was 8,177 higher than the current estimate for June 2017, and the 2022 base 5,639 lower than the current estimate for June 2022, the result of later revisions to the population estimates.
The 2017-based projections: below the low series
The actual population fell below Series C, the lowest of the main series, in June 2018 and stayed below it every year to 2025. The gap from the medium series had reached 109,304 by June 2019, before the pandemic, and widened to 708,325 (2.7%) by June 2022 after net overseas migration turned negative in the year to June 2021. As arrivals resumed, the gap narrowed to 368,735 by June 2025, still 41,386 below Series C.
Actual population against the 2017-based projections, June 2017 to June 2025
Millions of people at 30 June. Source: ABS, Population Projections, Australia, 2017 (base) to 2066; ABS, National, state and territory population, March 2026.
The 2022-based projections: above the high series
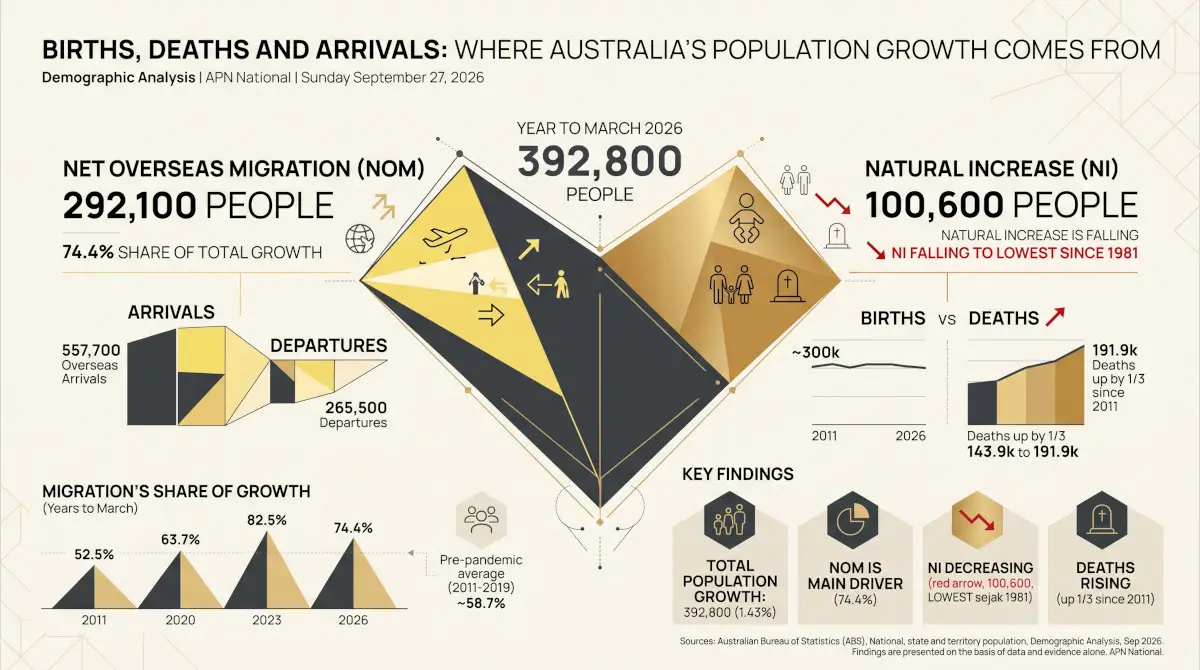
The next edition started from June 2022, the low point of the pandemic years. Net overseas migration then reached 538,300 in the year to June 2023, the highest of any year to June since the quarterly series began in 1981, and the actual population passed Series A, the highest of the main series, in June 2023. By June 2025 it was 206,689 above the medium series and 7,236 above Series A. How migration and natural increase have made up growth in these years is set out in Births, Deaths and Arrivals.
Actual population against the 2022-based projections, June 2022 to June 2025
Millions of people at 30 June. Source: ABS, Population Projections, Australia, 2022 (base) to 2071; ABS, National, state and territory population, March 2026.
| June | Actual | 2017-based, Series B | Actual less 2017-based B | 2022-based, Series B | Actual less 2022-based B |
|---|---|---|---|---|---|
| 2017 | 24,592,600 | 24,600,777 | −8,177 | — | — |
| 2018 | 24,963,300 | 25,015,825 | −52,525 | — | — |
| 2019 | 25,334,800 | 25,444,104 | −109,304 | — | — |
| 2020 | 25,649,200 | 25,873,480 | −224,280 | — | — |
| 2021 | 25,685,400 | 26,301,274 | −615,874 | — | — |
| 2022 | 26,018,700 | 26,727,025 | −708,325 | 26,013,061 | 5,639 |
| 2023 | 26,659,900 | 27,147,199 | −487,299 | 26,535,367 | 124,533 |
| 2024 | 27,194,300 | 27,562,195 | −367,895 | 26,971,766 | 222,534 |
| 2025 | 27,601,700 | 27,970,435 | −368,735 | 27,395,011 | 206,689 |
Persons at 30 June. Actual: estimated resident population, ABS, National, state and territory population, March 2026. Projections: ABS, Population Projections, Australia, 2017 (base) to 2066 and 2022 (base) to 2071, Series B.
The long view has moved too
The two editions also differ further out. The 2017-based medium series put Australia’s population at 35.7 million in 2046; the 2022-based medium series puts it at 33.9 million, about 1.8 million fewer. By 2066 the difference is about 4.4 million. The later edition uses different assumptions and starts from a lower base than the earlier edition had projected for 2022.
Medium-series projected population, by edition
Millions of people at 30 June, Series B. Source: ABS, Population Projections, Australia, 2017 (base) to 2066 and 2022 (base) to 2071.
What this does not show
A projection that differs from what happened is not an error: each series answers a conditional question, and the years compared here include the border closures of 2020 and 2021, which the 2017-based assumptions did not contemplate. The actual estimates for recent years are preliminary and will be revised, including after the 2026 Census. This piece compares totals only and says nothing about which projection is more likely to hold from here. Current growth is covered in The Population Growth Rate Since 2011, and the Demographic Analysis series carries the node readings.
Findings are presented on the basis of data and evidence alone.