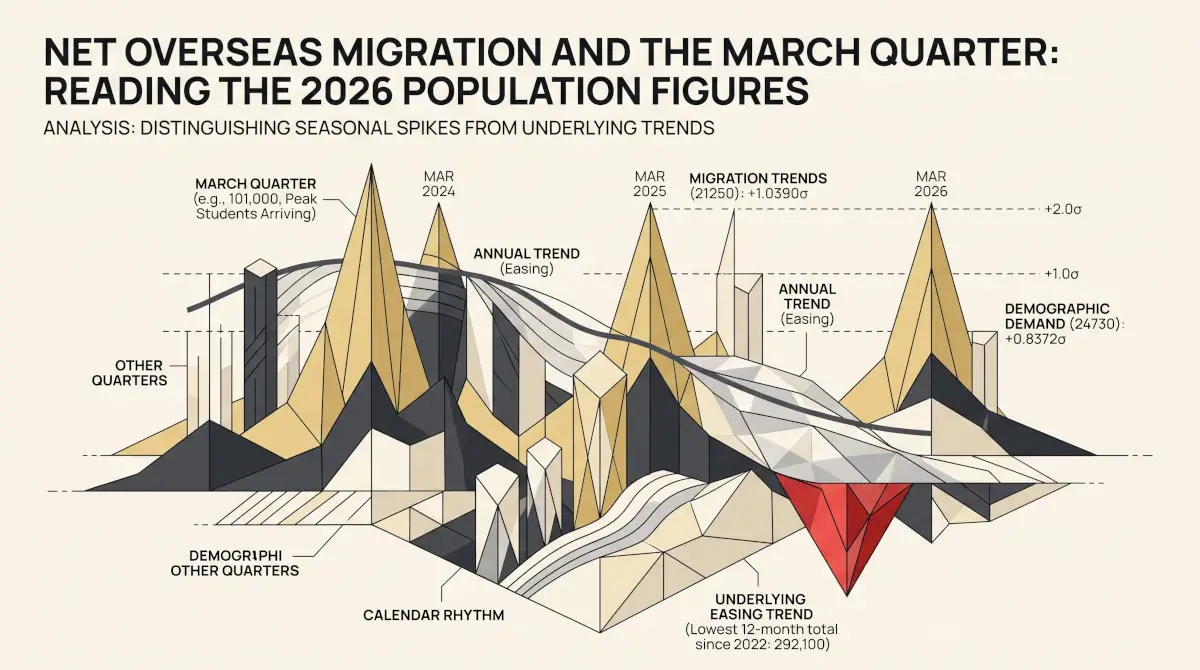

Net overseas migration added 101,000 people to Australia’s population in the March quarter of 2026, up from 56,100 in the December quarter. Read on its own, that is an 80% rise in a single quarter. It is not a turn in the trend. Net overseas migration has been higher in the March quarter than in the December quarter before it in every one of the past fifteen years, and the 2026 figure is the lowest March quarter since 2021. Over the year to March, net overseas migration was 292,100, down from 309,400 a year earlier and the lowest twelve-month total since the year to June 2022. Population growth over the year eased to 1.43%.
The gap between those two readings, a sharp quarterly rise and a continuing annual easing, comes from the calendar. The quarterly population figures are published without seasonal adjustment, and migration follows a strong annual rhythm. This piece sets out what that rhythm is, why it exists, how large it is, and how to read a quarterly population release without mistaking a seasonal peak for a change in direction.
Each σ figure is APN’s certified reading for that condition, measured in standard deviations from its 2011 to 2025 average. Migration Trends (21250) ranks at 86.7 against 61 quarters and Demographic Demand Conditions (24730) at 84.7 against 60 quarters. Both are built on quarterly figures published without seasonal adjustment; the March quarter effect described below applies to them.
What net overseas migration measures
Net overseas migration is the number of people who arrive to live in Australia less the number who leave to live elsewhere. The Australian Bureau of Statistics (ABS) does not count every border crossing. A traveller is added to the population only if they are in Australia for at least 12 of the following 16 months, and removed only if they are away for at least 12 of 16 months. The rule applies to everyone, whatever their visa or citizenship: an international student staying for a degree counts as an arrival, a tourist on a three-week holiday does not, and an Australian citizen who moves to London for two years counts as a departure.
Net overseas migration is one of two components of population change. The other is natural increase, which is births less deaths. Together they account for the whole quarterly change in the estimated resident population: in the March quarter of 2026, net overseas migration of 101,000 and natural increase of 29,900 took the population from 27,790,300 to 27,921,200, an increase of 130,900.
Because a traveller’s status depends on the following 16 months, the ABS cannot count the most recent quarters directly. It publishes preliminary estimates, based on models of how long travellers typically stay, and replaces them with final figures once enough time has passed to observe each traveller’s actual length of stay. The March quarter 2026 figure is preliminary and subject to revision.
A figure published without seasonal adjustment
Many economic series are published in more than one form. The monthly labour force figures, for example, come as original estimates, as seasonally adjusted estimates with the regular calendar pattern removed, and as a trend. The quarterly components of population change in the ABS national population release are published in original terms only: the figure for each quarter is simply what happened in that quarter, including any pattern that repeats at the same time every year.
That matters most when one quarter is compared with the quarter before it. A seasonally adjusted series can be compared quarter to quarter, because the recurring calendar effect has been removed. An original series cannot, without accounting for which quarters are being compared. A December quarter followed by a March quarter will show a rise in net overseas migration in almost any year, whether underlying migration is growing, steady or falling.
The March quarter peak
The chart below shows every quarter since 2012, with March quarters in gold. Before the border closures of 2020, the March quarter was the highest of the year in seven of the eight years from 2012 to 2019. The pattern returned once the borders reopened: the March quarter was again the highest in 2023, 2024 and 2025.
Net overseas migration per quarter, thousands
Source: ABS, National, state and territory population, March quarter 2026, Table 1. March quarter 2012 to March quarter 2026. March quarters in gold; year labels sit under each March quarter. Figures for the most recent quarters are preliminary.
The pattern lines up with the academic calendar. International students are the largest group of temporary visa holders counted in net overseas migration, and many begin their studies in February and March. Departures of students who have finished their courses tend to fall around the end of the academic year, in the December quarter. A smaller second peak in the September quarter lines up with the start of the second semester in July. Working holiday makers, temporary skilled workers and returning residents follow their own timing, but the student cycle is large enough to set the shape of the year.
The average quarter shows the size of the effect. From 2012 to 2019, net overseas migration averaged 75,600 in the March quarter and 44,000 in the December quarter. From 2023 to 2025, at a higher overall level, the averages were 134,000 and 73,300. In both periods the March quarter carried about a third of the calendar year’s net overseas migration, and the December quarter less than a fifth.
Average net overseas migration by quarter of the year, thousands
Source: ABS, National, state and territory population, March quarter 2026, Table 1. Calendar-year quarters. 2020 to 2022 are excluded because of the border closures and reopening.
The rise from the December quarter to the March quarter has occurred in all fifteen years from 2012 to 2026. Even in 2021, with the borders closed and more people leaving than arriving, the March quarter outflow was smaller than the December quarter outflow. Before 2020 the rise ranged from 20,200 to 49,300. The March quarter 2026 rise of 44,900 is within that range, and smaller than the rises of 2018 and 2022.
Change in quarterly net overseas migration from the December quarter to the following March quarter, thousands
Source: ABS, National, state and territory population, March quarter 2026, Table 1. Each bar is the March quarter figure less the preceding December quarter figure, labelled by the year of the March quarter.
Comparing like with like: March against March
The simplest way to remove the calendar effect is to compare a quarter with the same quarter in earlier years. On that basis the March quarter 2026 reads differently from the quarter-to-quarter change. At 101,000, it is higher than any March quarter from 2012 to 2020, when March quarters ranged from 63,800 to 88,800, but lower than every March quarter since the borders reopened: 107,500 in 2022, 165,500 in 2023, 128,700 in 2024 and 107,700 in 2025.
Net overseas migration in the March quarter of each year, thousands
Source: ABS, National, state and territory population, March quarter 2026, Table 1. The dotted line marks the average March quarter from 2012 to 2019, 75,600. The March quarter 2026 is shown in gold.
The same comparison applies to population growth. The population grew by 0.47% in the March quarter of 2026, against 0.28% in the December quarter. March quarter growth ranged from 0.42% to 0.53% between 2012 and 2020, and was 0.54% in 2022, 0.74% in 2023, 0.58% in 2024 and 0.50% in 2025. Measured against earlier March quarters, the 2026 figure is the lowest since 2021 and back within the range of the decade before the pandemic.
Comparing like with like: the year to each quarter
The second way to remove the calendar effect is to add up four consecutive quarters. Every twelve-month total contains exactly one March quarter, one June quarter, one September quarter and one December quarter, so the seasonal pattern cancels out. Twelve-month totals are the basis of the headline figures in the ABS release.
Over the year to March 2026, net overseas migration was 292,100. The twelve-month total peaked at 555,800 in the year to September 2023, as students and temporary workers returned after the border closures. It has fallen in most quarters since, to 309,400 in the year to March 2025, 298,800 in the year to December 2025 and 292,100 in the year to March 2026. It remains above the range of 181,200 to 263,400 recorded in the twelve-month totals from 2012 to 2019.
Net overseas migration over the year to each quarter, and in each single quarter, thousands
Source: ABS, National, state and territory population, March quarter 2026, Table 1. The gold line sums the four quarters to each quarter shown; the grey bars are the single-quarter figures. Year labels sit under the March quarter of that year.
Population growth over the year tells the same story. It was 1.43% in the year to March 2026, down from 1.46% in the year to December 2025 and 1.53% in the year to March 2025, and the lowest since the year to June 2022. In the years from 2012 to 2019, annual growth ranged from 1.45% to 1.80%. The chart shows how quarterly growth moves around the annual rate: the blue bars rise every March quarter, while the gold line has eased since 2023.
Growth in Australia’s estimated resident population, per cent
Source: ABS, National, state and territory population, March quarter 2026, Table 1. Growth in the quarter compares each quarter with the one before; growth over the year compares it with the same quarter a year earlier. March quarter 2017 to March quarter 2026; year labels sit under each March quarter.
Natural increase contributed about 100,600 people over the year to March 2026, a little lower than in the years to March 2023, 2024 and 2025 (105,500, 105,400 and 105,400). It too is higher in the March quarter, in 14 of the past 15 years, but the swings are far smaller than for migration and it does not move the annual picture.
Why a standardised reading moves with the season
APN measures conditions as standardised readings: how many standard deviations a figure sits from its average over a fixed period, 2011 to 2025. A reading of zero is an average quarter; a reading of +1.0σ is one standard deviation above it. Measured this way against all 60 quarters from 2011 to 2025, net overseas migration reads −0.10σ in the December quarter of 2025 and +1.04σ in the March quarter of 2026, a rise of 1.14 standard deviations in one quarter.
The same two quarters measured against their own season give a much smaller change. Against the 15 December quarters from 2011 to 2025, the December quarter 2025 reads +0.18σ. Against the 15 March quarters, the March quarter 2026 reads +0.48σ. Measured season against season, the rise is 0.30 standard deviations, about a quarter of the quarter-to-quarter figure. Both quarters sit modestly above the average for their time of year.
Quarterly net overseas migration, standard deviations from average, measured two ways
Source: ABS, National, state and territory population, March quarter 2026, Table 1. APN calculation. All quarters: against the 60 quarters from March 2011 to December 2025 (average 60,200, standard deviation 39,300). Same quarter: against the 15 December quarters, or the 15 March quarters, from 2011 to 2025.
Demographic Demand Conditions (24730) combines net overseas migration with quarterly population growth, each measured against all quarters, so it carries the same pattern. Its reading has risen from the December quarter to the March quarter in every year shown. On current data it moved from −0.37σ in the December quarter of 2025 to +0.84σ in the March quarter of 2026. The March 2026 reading is below the March readings of 2022 to 2025, which ranged from +1.02σ to +2.55σ.
Demographic Demand Conditions (24730), reading per quarter, standard deviations from the 2011 to 2025 average
Source: APN calculation from ABS, National, state and territory population, March quarter 2026. The reading is the average of net overseas migration and quarterly population growth, each measured against its own 2011 to 2025 average. March quarters in gold; year labels sit under each March quarter.
What this means for the APN Investment Conditions Index™
Demographic Demand Conditions (24730) is one of six conditions in the APN Investment Conditions Index™ (24700), which reads each condition at its most recent fully reported quarter. The March quarter population release updated that one condition; the other five were unchanged. The index’s Signed Reading, which shows which way conditions lean once each is counted for or against investment, moved from 32.8 to 52.7. Its Intensity Reading, which shows how far conditions sit from their historical centre without regard to direction, moved from 82.2 to 91.2.
On the Signed Reading, 50 marks an even balance between conditions working for and against investment. A reading of 52.7 sits just above that point. The move from 32.8 comes almost entirely from the demographic condition moving from a December quarter to a March quarter, and the pattern described above means a similar move is likely in the March quarter of most years. Measured against earlier March quarters, demographic demand is lower than in any March quarter since 2021. The movement in the index reflects the season in which the latest population figures fall, not a change in the direction of migration or population growth.
Reading the next population release
The June quarter 2026 figures are due in December 2026. The June quarter was the lowest or second-lowest quarter of the year for net overseas migration in every year from 2012 to 2019 and from 2023 to 2025, so a fall from the March quarter is likely whatever the underlying trend. Three comparisons give a clearer reading than the change from the previous quarter:
- The twelve-month total. Net overseas migration over the year to June 2026 against 301,500 in the year to June 2025, and against 292,100 in the year to March 2026.
- The same quarter a year earlier. The June quarter 2026 against 47,900 in the June quarter 2025 and 55,800 in the June quarter 2024.
- Annual population growth. Growth over the year to June 2026 against 1.43% in the year to March and 1.50% in the year to June 2025.
Revisions also matter. The most recent quarters are preliminary, and the ABS replaces them with final estimates as travellers’ actual lengths of stay become known. A comparison between a preliminary quarter and a final one can shift when the preliminary figure is revised.
Reading the figures
The March quarter 2026 population figures show net overseas migration and population growth continuing to ease. The twelve-month total for net overseas migration is the lowest since mid-2022 and still above its level in the decade before the pandemic, and annual population growth is just below the lowest annual rate recorded from 2012 to 2019. The quarterly rise from the December quarter is the regular March quarter peak, which lines up with the timing of student arrivals, and it is smaller relative to its season than the raw quarterly figures suggest. Readings built on quarterly population figures, including Migration Trends (21250) and Demographic Demand Conditions (24730), move with that season, and are best compared with the same quarter of earlier years. The APN Codex page for Migration Trends (21250) sets out the full quarterly history.
Findings are presented on the basis of data and evidence alone.