First home buyers took 36.21% of new owner-occupier housing loans in the March quarter of 2026, on the number of loan commitments. That is 5.0 percentage points above the average of 31.2% across the 24 years the series has run, and the share has now been above that average in every quarter since March 2019. It is nowhere near the 48.4% of June 2009. In the Australian Capital Territory, though, the March quarter reading of 42.9% is the highest in the series.
The node reading averages three measures on equal weights: the national share, the same share by state, and the first home buyer share of investor lending. The third begins in the September quarter 2019, and its baseline rests on 26 observations, below the platform’s minimum-observation standard, which is disclosed wherever the node reading is cited.
What the measure counts
The ABS publishes the number of new housing loan commitments each month, split between first home buyers and everyone else. The share used here is first home buyer commitments divided by all owner-occupier commitments, seasonally adjusted, quarterly from the September quarter 2002. It counts loans, not people and not dollars, and it covers owner-occupier lending only.
Being a share, it moves for two reasons: more first home buyers, or fewer of everyone else. A rise does not by itself mean more first home buyers entered the market. Both the numerator and the denominator need watching, and the periods below where the share moved most were periods when both were moving.
First home buyer share of new owner-occupier housing loans, per cent, September quarter 2002 to March quarter 2026
Source: ABS Lending Indicators, new loan commitments for owner-occupier housing, number, seasonally adjusted; first home buyers as a share of all owner-occupier commitments. The dotted line is the average across the whole series.
Twenty-four years in four movements
The series opens at 27.5% in the September quarter of 2002, falls to its series low of 22.0% in the March quarter of 2004, and then drifts up through the middle of the decade to sit around 30% by 2007.
The first sharp movement is the largest. Between the June quarters of 2008 and 2009 the share rose 16.3 percentage points, from 32.1% to 48.4%, its high for the series. Three things were happening at once: the Commonwealth’s First Home Owner Boost ran from October 2008, with its grants halved from October 2009 and withdrawn at the end of that year; the cash rate target fell from 7.25% to 3.00% between September 2008 and April 2009; and established buyers and investors pulled back, which lifts the share arithmetically. The series cannot separate these, and this piece does not attribute the movement to any one of them.
The second movement is a long decline. From that peak the share fell 25.3 points over six and a half years, reaching 23.1% at the end of 2015 and staying near that level through 2016 and into 2017. Most of that stretch followed APRA’s letter of 9 December 2014, written against what it called “currently very strong growth in investor lending”, which told lenders that annual investor credit growth materially above a 10% benchmark would draw supervisory attention — a benchmark it described as not a hard limit.
The third is a step. Between the June and September quarters of 2017 the share rose 4.0 points, from 24.1% to 28.2%, and kept climbing for three years. New South Wales and Victoria both introduced first home buyer stamp duty exemptions and concessions from 1 July 2017. The fourth is the pandemic: the share reached 41.7% in the September quarter of 2020, with HomeBuilder running for contracts signed between 4 June 2020 and 31 March 2021, the cash rate target at 0.25% and, again, other buyers hesitating.
Since the start of 2023 the series has been flatter than at any earlier point, holding between 35.0% and 37.0% for thirteen quarters. No other thirteen-quarter window in the series has a range as narrow as those 1.98 points. The March quarter 2026 reading of 36.21% sits inside that band.
Every state is above its own average, by very different margins
The share differs widely by state, and so does what counts as normal for each. Western Australia has the highest average across the series at 37.1% and South Australia the lowest at 25.7%, so the same reading means different things in different places. In the March quarter of 2026 the range ran from 42.9% in the Australian Capital Territory to 31.7% in Queensland.
Measured against each state’s own average, all eight are above it. The Australian Capital Territory is 14.4 points above its own average and at its highest reading in the series; Tasmania is 10.6 points above; Western Australia, whose average is the highest of any state, is only 0.9 points above it. Over the year to March 2026 six of the eight rose, Tasmania by 5.2 points; Victoria and the Northern Territory were the two that fell.
First home buyer share of new owner-occupier lending by state and territory, March quarter 2026, per cent
Source: ABS Lending Indicators, number of new loan commitments, seasonally adjusted. The note against each bar is that state’s average across the whole series, from the September quarter 2002.
| State or territory | March 2026 | A year earlier | Average since 2002 | Points above average | Series high | Quarter of that high |
|---|---|---|---|---|---|---|
| ACT | 42.9% | 38.3% | 28.5% | +14.4 | 42.9% | March 2026 |
| Vic | 39.1% | 40.5% | 34.9% | +4.1 | 50.4% | June 2009 |
| NT | 38.9% | 42.5% | 31.1% | +7.7 | 52.2% | September 2020 |
| WA | 38.1% | 35.1% | 37.1% | +0.9 | 53.1% | June 2009 |
| Tas | 37.1% | 31.8% | 26.4% | +10.6 | 38.7% | March 2009 |
| NSW | 33.9% | 32.9% | 28.2% | +5.8 | 51.6% | June 2009 |
| SA | 33.3% | 32.9% | 25.7% | +7.6 | 41.6% | June 2009 |
| Qld | 31.7% | 31.0% | 30.1% | +1.6 | 45.0% | June 2009 |
Source: ABS Lending Indicators, owner-occupier new loan commitments by state, number, seasonally adjusted, September quarter 2002 to March quarter 2026.
Distance above each state’s own average since 2002, percentage points, March quarter 2026
APN calculation from the same series. Each bar is the March quarter 2026 share less that state’s own average across the series; the note gives the current share.
Why the node reading sits mid-range when the share does not
APN reads this through First Home Buyer Lending Share (21660), which averages three measures on equal weights: the national share above, the same share by state, and the first home buyer share of investor lending. At the March quarter of 2026 the first two sit about one standard deviation above their baselines. The third sits well below its own, and it pulls the composite back to +0.0791σ — a position of 23.1 against the 27 quarters in which all three measures are present.
That ranking population begins in the September quarter 2019, because the investor measure does. It is a much shorter window than the 24 years of the headline share, and the investor measure’s baseline rests on 26 observations, below the platform’s minimum-observation standard. Both facts are disclosed wherever the node reading is cited. The reading describes first home buyer participation across owner-occupier and investor lending together; the 36.21% above describes owner-occupier lending alone.
What the measure does and does not show
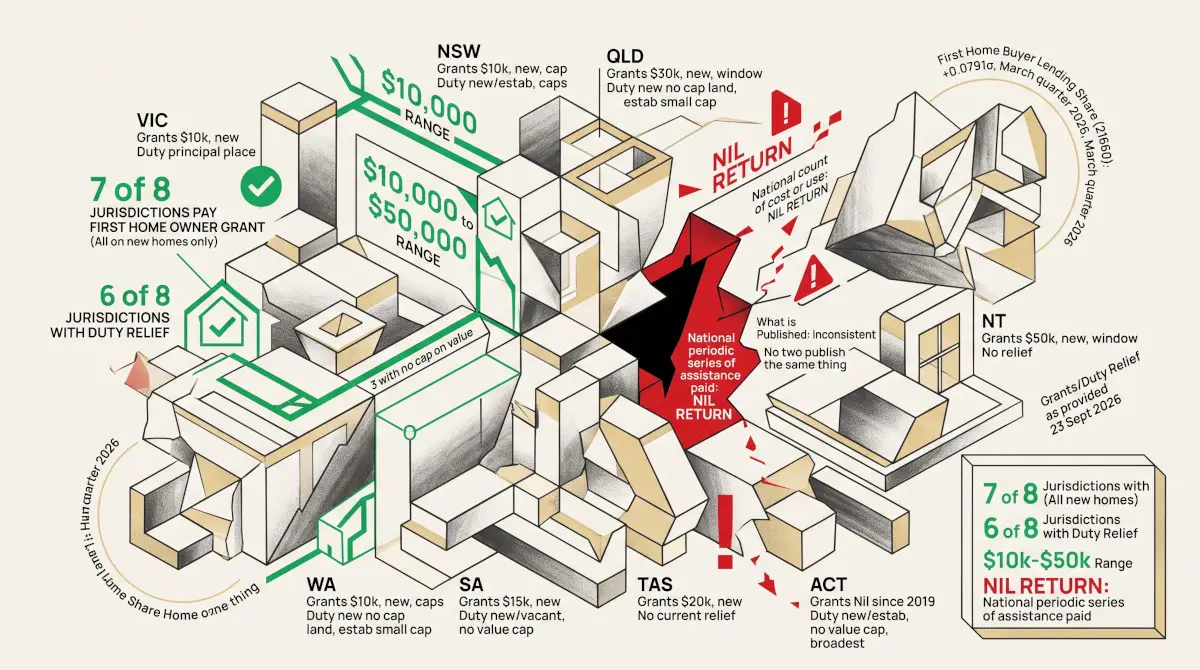
This is a measure of behaviour, not of policy. No series on grants, duty concessions, guarantee places or eligibility caps is loaded anywhere in the platform, so the effect of any scheme on the share is NIL RETURN here: the dates above are stated as co-timing and nothing more. Interest rates, credit standards, prices, the supply of stock and the behaviour of other buyers all move the same number.
Three further limits. The series counts commitments, so a commitment that is never drawn down still counts, and two borrowers on one loan count once. It is seasonally adjusted, so quarterly movements are not raw counts. And because it is a share of owner-occupier lending, a quarter in which established buyers retreat will raise it even if first home buyer numbers are flat. A first home buyer who borrows to invest rather than to occupy does not appear in it at all.
APN has covered the interaction of one scheme cap with one local market in its review of the Home Guarantee Scheme cap around Yass; this piece is the national series behind that kind of question.
Findings are presented on the basis of data and evidence alone.