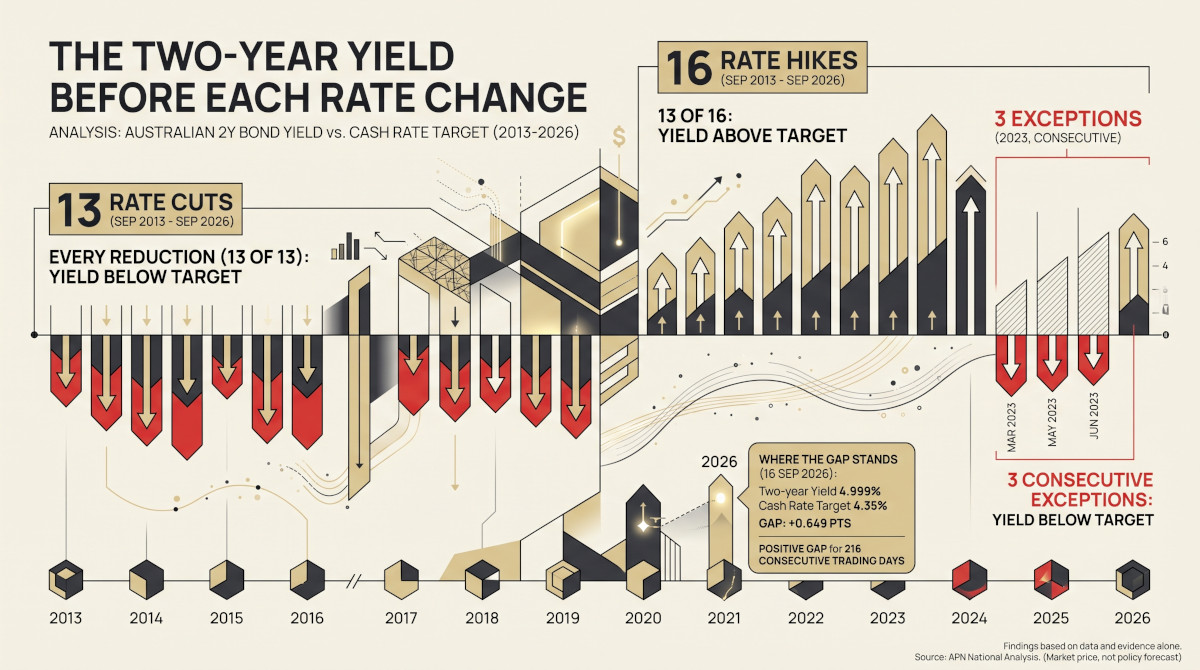

Across the 29 changes to the cash rate target since 2 September 2013, the two-year Australian Government bond yield, read at the last close before each decision was announced, sat below the target before 12 of the 13 reductions and above it before 13 of the 16 increases. The one reduction it did not precede was the unscheduled reduction of March 2020, when the yield was 0.015 points above the target; the three increases it did not precede were all in the first half of 2023. The yield is a market price rather than a forecast, and what follows is a description of where it has sat, not a claim about what comes next.
The two-year government bond yield is one of the four inputs to the node, alongside the cash rate target, indicator lending rates and the share of new lending at high debt-to-income multiples. The Reserve Bank states that the yields in this table are not financial benchmarks and are published as a convenience, informed by its own assessment of closing yields.
A market price, not a policy rate
The cash rate target is set. The two-year bond yield is traded: it is what buyers and sellers of two-year Australian Government debt settle on, and it therefore embeds a view about the average policy rate expected over the next two years. Where the two sit relative to one another is a reading of how market pricing is positioned against the rate actually in force.
The Reserve Bank publishes the yield in its capital market yields table and is careful about its status: the figures are its own assessment of closing yields, informed by market participants, and the Bank states they are not financial benchmarks and carry no special status. The two-year series begins in September 2013, which is why this piece starts there rather than in 2011; earlier bond yields are published separately, in the Bank’s historical statistics, and are not used here.
The two-year bond yield and the cash rate target, 2013 to 2026
Per cent per annum, at the last trading day of each month; the final point is 16 September 2026, the latest day published, so September 2026 is a part month. Sources: Reserve Bank of Australia, Table F2 (Australian Government two-year bond) and the cash rate target as in force on that day.
The gap
Over 3,278 trading days the yield has been above the target on 1,736 of them and below it on 1,528, with 14 days level — 53.0 per cent on the positive side. Those are not 3,278 independent readings — the gap holds its sign for long stretches, and the current one has run 216 days — so the split describes what happened rather than giving a probability. The distance has been anything but even. The furthest it has reached on the positive side is 2.664 points, on 3 May 2022, the day the first increase of the tightening cycle was announced. The furthest the other way is −0.893 points, on 5 May 2023, two days after an increase took effect late in that same cycle.
Two-year yield less the cash rate target
Percentage points, at the last trading day of each month; the final point is 16 September 2026. Positive means the two-year yield is above the target. Sources: Reserve Bank of Australia Tables F1 and F2.
Before each change
Setting the gap against each change to the target gives 29 observations: 16 increases and 13 reductions. The Reserve Bank announces a decision at 2.30 pm and it takes effect the following day, so a closing yield on the day of the announcement already reflects the decision. For each change, the table therefore reports the gap at the last close before the announcement, the average over the 30 trading days to that close, and the average over the 30 trading days from the change taking effect.
| Effective | Change | Gap, 30 days before | Gap, last close before announcement | Gap, 30 days from |
|---|---|---|---|---|
| 4 February 2015 | reduction to 2.25% | −0.325 | −0.511 | −0.365 |
| 6 May 2015 | reduction to 2.00% | −0.431 | −0.338 | 0.008 |
| 4 May 2016 | reduction to 1.75% | −0.067 | −0.132 | −0.127 |
| 3 August 2016 | reduction to 1.50% | −0.166 | −0.242 | −0.039 |
| 5 June 2019 | reduction to 1.25% | −0.239 | −0.371 | −0.178 |
| 3 July 2019 | reduction to 1.00% | −0.295 | −0.268 | −0.126 |
| 2 October 2019 | reduction to 0.75% | −0.222 | −0.243 | 0.010 |
| 4 March 2020 | reduction to 0.50% | −0.057 | −0.282 | −0.024 |
| 20 March 2020 | reduction to 0.25% | −0.061 | 0.015 | −0.014 |
| 4 November 2020 | reduction to 0.10% | −0.101 | −0.137 | −0.004 |
| 4 May 2022 | increase to 0.35% | 1.845 | 2.460 | 2.239 |
| 8 June 2022 | increase to 0.85% | 2.281 | 2.319 | 1.814 |
| 6 July 2022 | increase to 1.35% | 2.152 | 1.710 | 1.203 |
| 3 August 2022 | increase to 1.85% | 1.577 | 1.164 | 1.035 |
| 7 September 2022 | increase to 2.35% | 1.128 | 1.253 | 0.825 |
| 5 October 2022 | increase to 2.60% | 1.062 | 1.072 | 0.606 |
| 2 November 2022 | increase to 2.85% | 0.834 | 0.620 | 0.239 |
| 7 December 2022 | increase to 3.10% | 0.390 | 0.106 | 0.065 |
| 8 February 2023 | increase to 3.35% | 0.073 | −0.075 | −0.109 |
| 8 March 2023 | increase to 3.60% | 0.058 | 0.127 | −0.663 |
| 3 May 2023 | increase to 3.85% | −0.718 | −0.660 | −0.484 |
| 7 June 2023 | increase to 4.10% | −0.576 | −0.179 | −0.030 |
| 8 November 2023 | increase to 4.35% | 0.096 | 0.242 | −0.234 |
| 19 February 2025 | reduction to 4.10% | −0.500 | −0.498 | −0.333 |
| 21 May 2025 | reduction to 3.85% | −0.749 | −0.509 | −0.556 |
| 13 August 2025 | reduction to 3.60% | −0.510 | −0.508 | −0.248 |
| 4 February 2026 | increase to 3.85% | 0.472 | 0.574 | 0.451 |
| 18 March 2026 | increase to 4.10% | 0.450 | 0.703 | 0.574 |
| 6 May 2026 | increase to 4.35% | 0.584 | 0.587 | 0.256 |
Percentage points. Effective dates from the Reserve Bank’s cash rate series; each change was announced the day before it took effect. Sources: Reserve Bank of Australia Tables F1 and F2.
The sign of the gap at the last close before an announcement matched the direction of the change on 25 of the 29 occasions. That figure covers two findings of very different strength, and they are worth separating. The yield is above the target on 53.0 per cent of all trading days, so a count of changes preceded by a positive gap has that share to beat before it says anything.
Twelve of the 13 reductions were preceded by a yield below the target. On the share of days the gap is negative, 6.1 of them would have been; 12 is far more than that share would suggest, although the reductions are clustered in time rather than independent of one another. The increases are a weaker result: 13 of the 16 were preceded by a positive gap against 8.5 expected, better than the base rate but by less. The stronger finding is about reductions.
The average gap around a change in the target
Percentage points, averaged across the 13 reductions and 16 increases since September 2013. Sources: Reserve Bank of Australia Tables F1 and F2.
The gap is at its widest at the last close before a change is announced — 0.751 points ahead of an increase, −0.310 ahead of a reduction — wider than across the preceding thirty days, and closer to zero across the thirty days from the change taking effect, at 0.487 and −0.154.
It is the target that closes that distance, not the yield. The gap ahead of an increase narrows by 0.265 points over those thirty days. Across the same window the target in force rose 0.367 points on average — the change itself, 0.313 points on average, plus later increases that fell inside the window — while the yield rose a further 0.102 points, so the narrowing is the target’s rise less the yield’s. Reductions behave the same way in reverse: a 0.156-point narrowing, with the target 0.261 points lower on average (an average single change of 0.242 points) and the yield falling another 0.105 points. The target moves towards the yield, and the yield keeps moving the same way.
The four exceptions
One reduction was preceded by a yield above the target: the reduction of 20 March 2020, decided at an unscheduled meeting and announced the day before. At the last close before that announcement the gap was 0.015 points, level with the target to within two hundredths of a point.
Three increases were preceded by a yield below the target: 8 February 2023, 3 May 2023 and 7 June 2023. They were three of the four increases in the first half of 2023, in the closing stage of the 2022–23 tightening; the increase between the first two, on 8 March 2023, was preceded by a gap of 0.127 points. The first and third were small, gaps of −0.075 and −0.179 points. The second was not: the yield sat 0.660 points below the target at the last close before the May 2023 change was announced, and on 5 May 2023, two days after that change took effect, reached the widest negative reading in the whole series.
What the three increases have in common is their position in the cycle. At each, the two-year yield sat below the rate then in force, and the target rose regardless. They came late in the tightening, before its final increase on 8 November 2023. A measure that tracks the direction of change most of the time, but not late in a cycle, is least informative where a reading of it would matter most. That is a limitation of the measure, and it is the reason this piece draws no inference from it.
Where the gap stands
On 16 September 2026 the two-year yield was 4.999 per cent against a target of 4.35 per cent, a gap of 0.649 points. It has been positive on every trading day since 10 November 2025, a run of 216 trading days.
Those are the two facts. This piece states no view about what the Reserve Bank will do next, and the history above — including its four exceptions, three of them late in a tightening cycle — is not a basis on which to form one. Attributed commentary on bond yields and Australian rates is carried separately in the Opinion series, where the views are the speakers’ own: an economist on the global bond sell-off and its line to Australian mortgage rates, and the Reserve Bank’s Deputy Governor on upside risks to inflation.
What this measure does not show
It is not a forecast and does not become one by being counted. A bond yield is a price struck between buyers and sellers with their own horizons, holdings and obligations; expectations about the policy rate are one influence on it among several, alongside the supply of government debt, conditions in offshore bond markets and demand for a safe two-year asset. The single number the table publishes separates none of them out.
The evidence here is 29 events across thirteen years, and most of them belong to two clusters — a long run of reductions and a long run of increases — rather than to 29 independent occasions. A count of that kind describes what happened; it does not measure how reliably anything holds.
The gap says nothing about the level of either series, about what borrowers are charged, or about the timing of a change as against its direction. The yield itself does bear on what borrowers are charged, in a way this piece does not measure: fixed rates are priced off longer-term funding costs, so fixed mortgage pricing follows yields of this kind rather than the cash rate, and can move when the cash rate has not. The structural spread and the two-instrument regime sets out that pathway. And the Reserve Bank states that the yields in this table are its own assessments, not benchmarks, and are intended as a convenience rather than as an administered rate.
Findings are presented on the basis of data and evidence alone.