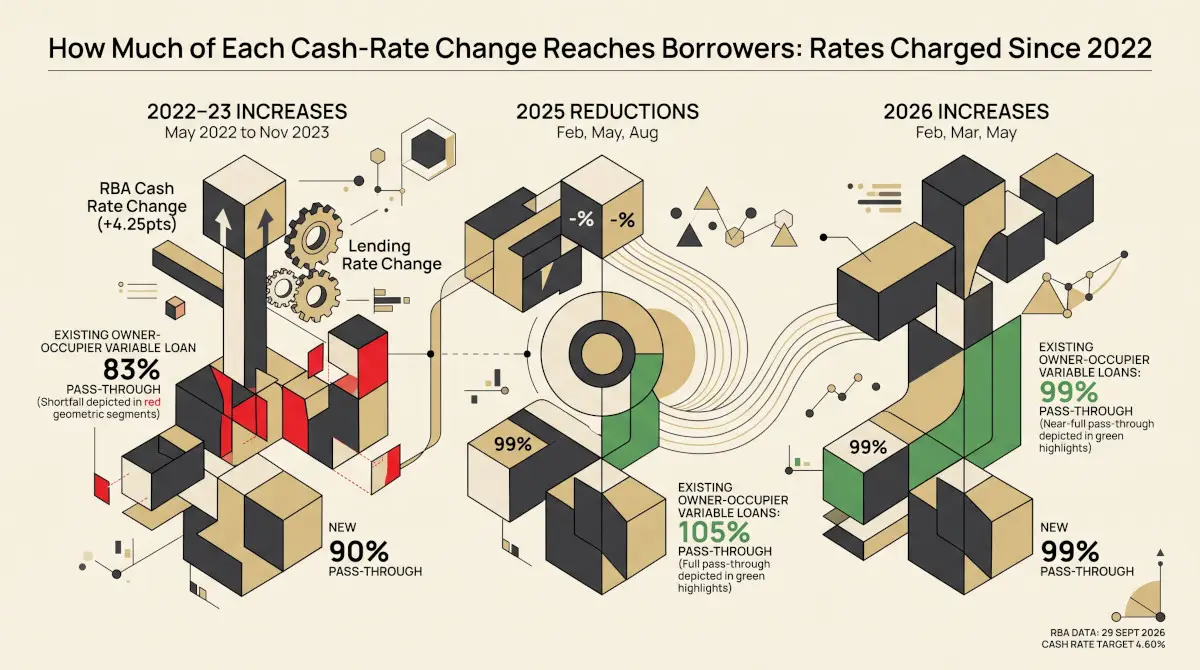

On 29 September 2026 the Reserve Bank raised the cash rate target by 0.25 of a percentage point to 4.60%, the 17th increase since May 2022. How much of a change reaches borrowers has not been constant. Across the 13 increases of 2022 and 2023, the cash rate rose 4.25 points and the average rate charged on existing owner-occupier variable loans rose 3.53, about 83% of it. The three reductions of 2025 and the three increases earlier in 2026 reached those same loans in full. The Reserve Bank’s tables of rates charged run to July 2026, so the September increase is not yet in them.
The node reading is at the June quarter 2026, the latest quarter in which all four of its inputs are loaded; only the March quarter 2026 (+1.0049σ) ranks higher. The lending-rate data end before the September 2026 decision.
Two published rates, and the one borrowers pay
The Reserve Bank publishes two kinds of home-loan rate. Table F5, Indicator Lending Rates, reports the standard variable rate large banks advertise, read on the last working day of each month. Table F6, Housing Lending Rates, reports the rates lenders actually charge, as monthly averages weighted by the value of loans, compiled from returns lenders make to the Australian Prudential Regulation Authority. F6 separates loans funded in the month (new borrowers and those refinancing) from all loans outstanding, and owner-occupiers from investors. It begins in July 2019.
The advertised rate has followed the cash rate one-for-one since December 2020, which Above the Cash Rate: What Borrowers Are Actually Charged sets out in full. Every one of the 16 increases from May 2022 to May 2026 appears in it, in full, by the last working day of the month the increase took effect. This piece looks at the rates charged, which is where the full amount has not always arrived.
The cash rate target and the average rate charged on owner-occupier variable loans, July 2019 to July 2026
APN chart based on Reserve Bank of Australia data: Statistical Tables F1 and F6, July 2019 to July 2026, Housing Lending Rates, variable-rate, all institutions (FLRHOFVA, FLRHOOVA). Monthly averages of rates charged; the cash rate target as in force on the last day of each month (Table F1, FIRMMCRTD).
This article measures pass-through as the change in an average lending rate divided by the change in the cash rate target over the same months. A figure of 100% means the whole change reached the average rate; below 100%, part of it did not; above 100%, the lending rate moved further than the cash rate.
Three episodes since 2022
Since May 2022 the cash rate target has moved in three distinct runs: 13 increases from May 2022 to November 2023, three reductions in February, May and August 2025, and three increases in February, March and May 2026. The five reductions of July 2019 to November 2020 fall before this period and are not measured here. Each is measured below from the month before its first change to the month after its last, so every change has at least a full month of loans behind it.
Share of each episode’s cash-rate change that reached the average variable rate charged, owner-occupiers
APN calculation based on Reserve Bank of Australia data: Statistical Tables F1 and F6, episodes as listed in the table below, Housing Lending Rates, variable-rate, all institutions (FLRHOFVA, FLRHOOVA). Change in the average rate charged as a share of the change in the cash rate target, from the month before the first change in each episode to the month after the last.
| Episode | Months compared | Cash rate target | Advertised standard variable | New loans, owner-occupier | New loans, investor | Existing loans, owner-occupier | Existing loans, investor |
|---|---|---|---|---|---|---|---|
| 2022–23 increases | April 2022 to December 2023 | +4.25 | +4.25 | +3.83 (90%) | +3.81 (90%) | +3.53 (83%) | +3.48 (82%) |
| 2025 reductions | January 2025 to September 2025 | −0.75 | −0.75 | −0.74 (99%) | −0.78 (104%) | −0.79 (105%) | −0.80 (107%) |
| 2026 increases | January 2026 to June 2026 | +0.75 | +0.75 | +0.74 (99%) | +0.74 (99%) | +0.74 (99%) | +0.73 (97%) |
APN calculation based on Reserve Bank of Australia data: Statistical Tables F1, F5 and F6, published 7 and 29 September 2026. Percentage points; bracketed figures are the change as a share of the change in the cash rate target. Advertised rate: Table F5, FILRHLBVS; rates charged: Table F6, FLRHOFVA, FLRHIFVA, FLRHOOVA and FLRHIOVA.
Across the 2022–23 increases, the 4.25-point rise in the cash rate became a 3.83-point rise in the average rate on new owner-occupier variable loans (90%) and a 3.53-point rise on existing ones (83%). Investors’ rates moved almost identically: 3.81 points on new loans and 3.48 on existing ones. The advertised standard variable rate rose the full 4.25 points over the same months, so the gap between the advertised rate and the rate existing owner-occupiers were charged widened from 1.66 points in April 2022 to 2.38 points in December 2023.
The 2025 and 2026 episodes looked different. The three reductions of 2025 lowered the cash rate by 0.75 points, and rates charged fell by between 0.74 and 0.80 points across the four loan types, the full amount or slightly more. The three increases of 2026 raised the cash rate by 0.75 points and rates charged by 0.73 to 0.74 points. Measuring each episode one month later changes none of these results by more than 0.04 of a point.
Change by change
Episode totals can hide the timing. The chart below takes each change since 2022 that was followed by at least a month with no other change: nine in all. For each one it compares the average rate on existing owner-occupier variable loans in the month before the change with the month after it.
Share of each cash-rate change reaching the average rate on existing owner-occupier variable loans within a month
APN calculation based on Reserve Bank of Australia data: Statistical Tables F1 and F6, December 2022 to May 2026, Housing Lending Rates, outstanding, owner-occupied, variable-rate, all institutions (FLRHOOVA). Change in the average rate on existing loans from the month before each change to the month after it, as a share of the change. Changes shown are those with no other change taking effect in the same or the following month.
| Change took effect | Cash rate change | New loans, owner-occupier | Existing loans, owner-occupier | Existing loans, investor |
|---|---|---|---|---|
| 7 December 2022 | +0.25 | +0.16 | +0.17 (68%) | +0.16 |
| 8 March 2023 | +0.25 | +0.24 | +0.17 (68%) | +0.16 |
| 7 June 2023 | +0.25 | +0.29 | +0.20 (80%) | +0.18 |
| 8 November 2023 | +0.25 | +0.24 | +0.22 (88%) | +0.22 |
| 19 February 2025 | −0.25 | −0.25 | −0.25 (100%) | −0.26 |
| 21 May 2025 | −0.25 | −0.24 | −0.26 (104%) | −0.26 |
| 13 August 2025 | −0.25 | −0.24 | −0.26 (104%) | −0.26 |
| 18 March 2026 | +0.25 | +0.26 | +0.25 (100%) | +0.25 |
| 6 May 2026 | +0.25 | +0.26 | +0.25 (100%) | +0.24 |
APN calculation based on Reserve Bank of Australia data: Statistical Tables F1 and F6, December 2022 to May 2026. Percentage points, month before the change to the month after it; bracketed figure as a share of the change. Table F6, FLRHOFVA, FLRHOOVA and FLRHIOVA.
For the four increases from December 2022 to November 2023, existing owner-occupier rates rose between 0.17 and 0.22 of a point for each 0.25-point increase: 68% to 88%. For all five changes from February 2025 to May 2026, in either direction, the move was between 100% and 104% of the change. After the three 2023 increases, rates on new loans rose 0.24 to 0.29 of a point, more than rates on existing loans; after the December 2022 increase the average new owner-occupier rate rose 0.16 of a point by January 2023. In three of the four, the shortfall sat mainly with existing borrowers.
The advertised rate lagged twice. The two reductions that took effect after the 18th of the month, in February and May 2025, had moved the advertised standard variable rate by 0.15 of a point by the last working day of that month, and by the full 0.25 a month later. The March 2026 increase, which took effect on 18 March, was in the advertised rate in full by the end of March.
Where the September increase will show
The cash rate target stood at 4.35% from May to September 2026. In July 2026, the latest month in Table F6, new owner-occupier variable loans averaged 6.24%, existing ones 6.24%, and investors’ new and existing loans 6.40% and 6.48%. The advertised standard variable rate was 8.77% at the end of August.
The Reserve Bank updates Table F5 for each month early in the month that follows, and Table F6 early in the second month after. October 2026 is the first full month at the new target, so on that timetable the advertised rate for October would appear in early November and the rates charged in early December. This article states no view on what those figures will show or on future decisions.
What these measures do not show
They are averages across lenders, weighted by loan value, so they do not describe any single loan. An average rate on existing loans also moves when the mix of loans changes, without any borrower’s rate changing: refinancing to a cheaper lender lowers it, and in 2023 many borrowers whose fixed-rate terms expired entered the variable pool at the rates then on offer. The tables do not separate these effects from repricing, and they do not show why the 2022–23 increases reached existing borrowers only in part. They cover variable-rate loans only. The Reserve Bank describes the figures as subject to revision.
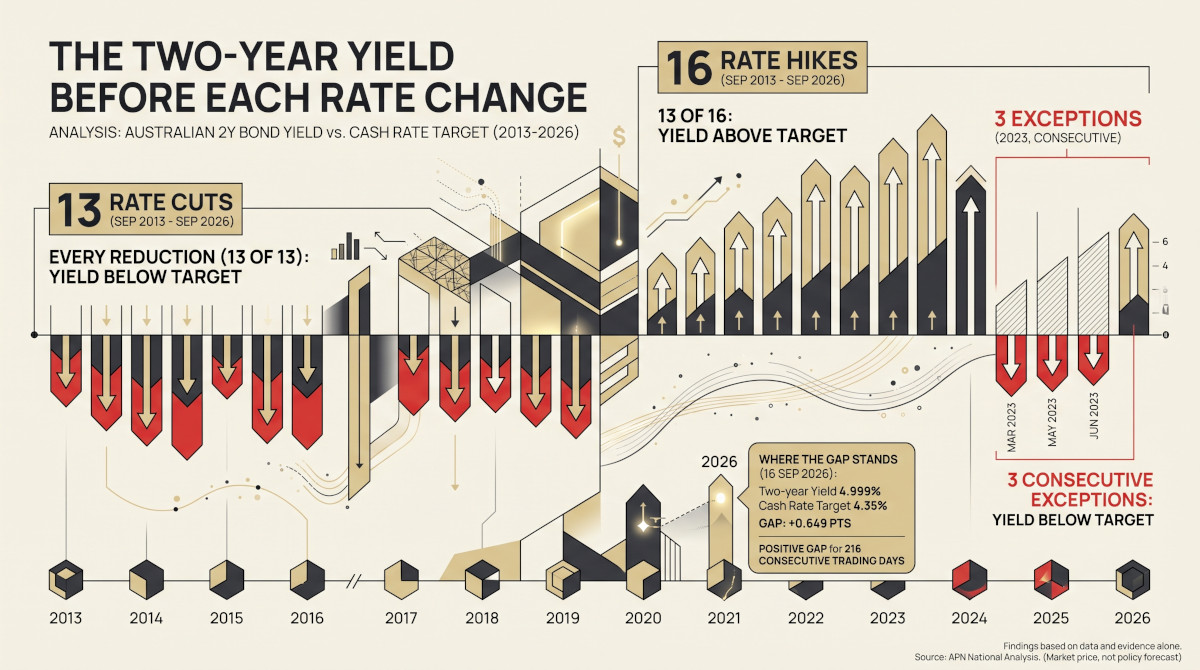
A rise in the rate charged is also not the only way a cash-rate change reaches a household. Lenders test new borrowers at a rate above the loan rate, so the same change alters how much can be borrowed; The Serviceability Buffer: Three Settings Since 2014 covers that test. How market pricing moved ahead of each change is covered in The Two-Year Yield Before Each Rate Change.
- Reserve Bank of Australia (Reference period: July 2019 to July 2026) Statistical Table F6: Housing Lending Rates (published 7 September 2026) [https://www.rba.gov.au/statistics/tables/], accessed 29 September 2026.
- Reserve Bank of Australia (Reference period: to August 2026) Statistical Table F5: Indicator Lending Rates (published 7 September 2026) [https://www.rba.gov.au/statistics/tables/], accessed 29 September 2026.
- Reserve Bank of Australia Statement by the Monetary Policy Board: Monetary Policy Decision, media release 2026-27, 29 September 2026 [https://www.rba.gov.au/media-releases/2026/mr-26-27.html], accessed 29 September 2026.
- Reserve Bank of Australia Statistical Table F1: Interest Rates and Yields – Money Market (published 29 September 2026) [https://www.rba.gov.au/statistics/tables/], accessed 29 September 2026.
Reserve Bank of Australia material is used under a Creative Commons Attribution 4.0 International licence. Table F6 is compiled by the Reserve Bank from returns lenders make to the Australian Prudential Regulation Authority. Calculations and index readings are APN’s and are not attributable to the Reserve Bank.
Findings are presented on the basis of data and evidence alone.