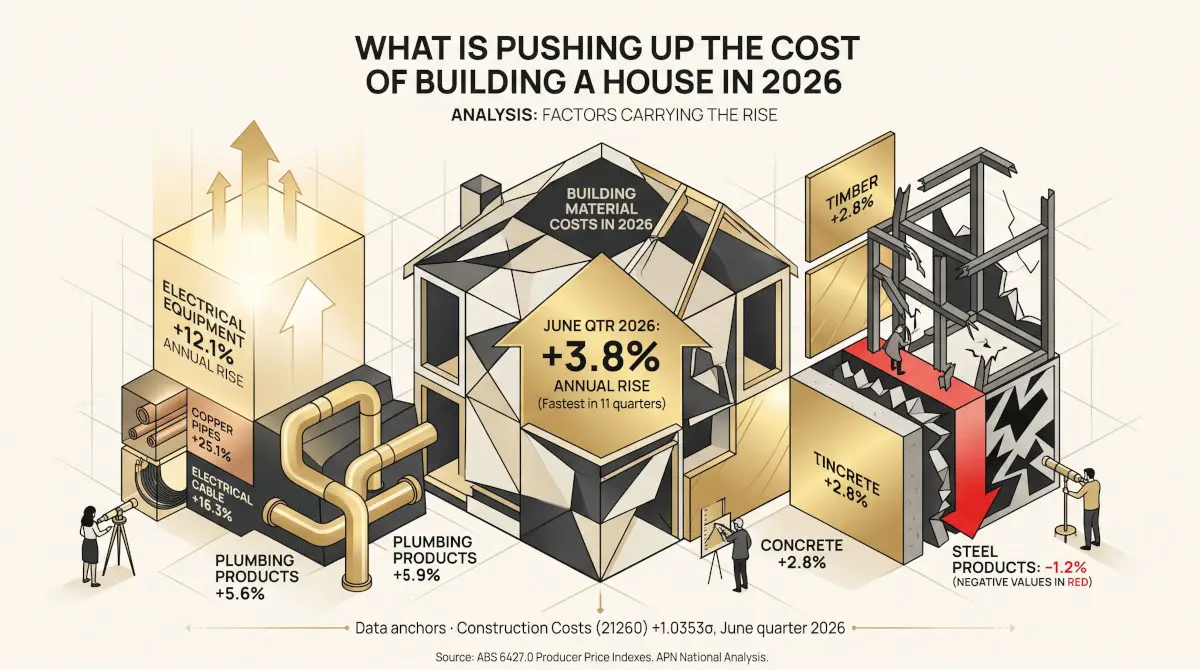

The materials that go into a new house cost 3.8% more in the June quarter 2026 than a year earlier, the fastest annual rise in eleven quarters. For the two years to the December quarter 2025, the same figure never went above 2.4%. What has changed is not only the pace but the composition: electrical equipment rose 12.1% over the year, more than three times the all-groups figure, while steel products fell 1.2% and were the only one of the ten material groups to fall at all. Through the 2021–22 rise in building costs the order was close to the reverse: steel led every other group, timber came second, and electrical equipment was ninth of ten.
The σ figure is APN’s certified reading for construction cost and supply chain conditions: how far they sit from their 2011–2025 average, measured in standard deviations. It combines four inputs, of which the materials price index used throughout this article is one. The price figures here are published ABS data and are not the node reading.
What this index measures, and what it leaves out
The figures in this article come from the Australian Bureau of Statistics producer price index for inputs to the house construction industry, a quarterly series that has run since the September quarter 1966. It prices the materials a house builder buys — timber, bricks, concrete, steel, pipework, cable, fittings and the rest — valued at the price including delivery to the site.
It is a materials index and nothing more. On-site labour is outside its scope, as are land, finance, council and utility charges, compliance costs and the builder’s own margin. A reader looking for the full cost of building a house will not find it here, and the phrase should be read narrowly throughout: what follows is about what the materials cost, not what a house costs.
Three further properties shape what the numbers can be asked to do. The index is set to 100.0 across the 2011–12 financial year, so a reading of 167.8 means the materials basket costs 1.68 times what it did then. Prices are collected in the six state capital cities, and each capital stands in for its state, so the territories are not separately represented. And the series is published in original form, without seasonal adjustment, which is why the annual comparison is the one used here rather than the change from one quarter to the next.
The June quarter in sixty years of context
Materials prices rose 3.8% over the year to the June quarter 2026, and 2.1% in the quarter alone — the largest single-quarter movement since the December quarter 2022. The annual figure is not a high reading by the standards of the series. Of the 236 quarters for which an annual change can be calculated, 129 show a slower annual rise than the June quarter 2026 and 106 a faster one, and the median across all of them is 3.5%. The annual rate has returned to something close to ordinary for this series; what was unusual was the two years before it.
The 2021–22 rise is the comparison most readers will have in mind, and it was a different order of movement. The annual rate peaked at 17.3% in the June quarter 2022, and from the December quarter 2020 to the March quarter 2023 the materials basket rose 29.9%.
Even that peak is not the fastest annual rise the series has seen. The Q2 2022 reading ranks 6th of the 236, and the five quarters above it all fall in 1974 and 1975, when the annual rate reached 22.5%.
Annual change in the price of materials used in house construction, %, 1967–2026
Source: ABS 6427.0 Producer Price Indexes, Table 18, Input to the House construction industry, weighted average of six capital cities, original series. Annual changes begin in 1967, four quarters after the series starts.
Two flat years, then a turn
Between the December quarter 2023 and the December quarter 2025 the annual rate sat in a narrow band, between 1.1% and 2.4% in every one of those nine quarters. It has since moved to 2.5% in the March quarter 2026 and 3.8% in the June quarter 2026. The last quarter with a faster annual rise was the September quarter 2023, when the comparison was still measuring against the tail of the earlier rise.
Annual change in materials prices, %, quarterly, 2019–2026
Source: ABS 6427.0 Table 18, all groups, weighted average of six capital cities. The most recent quarter is shown in gold.
Which materials are carrying the rise
The index divides into ten material groups. Over the year to the June quarter 2026 they did not move together. Electrical equipment rose 12.1%, more than three times the all-groups figure and the fastest annual rate for that group since the March quarter 2022. Plumbing products followed at 5.6%, then other metal products and cement products, both at 4.9%. At the other end, other materials rose 2.1% and steel products fell 1.2%, the only group in the set to fall.
Annual change by material group, %, year to the June quarter 2026
Source: ABS 6427.0 Table 18, weighted average of six capital cities. The all-groups figure over the same year was 3.8%. Bars in slate denote a fall.
A different set of materials from last time
Set the year against the two periods either side of it and the ordering inverts. Across the 2021–22 rise every one of the ten groups went up, led by steel products at 44.8% and timber, board and joinery at 38.8%; electrical equipment was ninth of the ten, at 17.7%. Over the thirteen quarters since, steel products have fallen 17.1% and timber has risen 2.6%, ninth of the ten, while electrical equipment leads at 23.9%.
Over that later window the two groups that defined the earlier rise are the two slowest, and the group that trailed it leads. The table below lists all ten in the order they ranked through the 2021–22 rise.
| Material group | Dec 2020 to Mar 2023 | Mar 2023 to Jun 2026 | Year to Jun 2026 | Index, Jun 2026 |
|---|---|---|---|---|
| Steel products | 44.8% | −17.1% | −1.2% | 126.7 |
| Timber, board and joinery | 38.8% | 2.6% | 2.8% | 173.0 |
| Other metal products | 30.3% | 8.0% | 4.9% | 161.4 |
| Ceramic products | 27.5% | 12.3% | 3.3% | 188.2 |
| Plumbing products | 25.8% | 4.8% | 5.6% | 161.2 |
| Other materials | 25.0% | 11.0% | 2.1% | 162.0 |
| Cement products | 22.6% | 18.0% | 4.9% | 172.9 |
| Concrete, cement and sand | 18.0% | 15.4% | 2.8% | 148.5 |
| Electrical equipment | 17.7% | 23.9% | 12.1% | 213.8 |
| Installed gas and electrical appliances | 8.8% | 7.8% | 4.4% | 138.6 |
Change by material group since the March quarter 2023, %
Source: ABS 6427.0 Table 18, weighted average of six capital cities, March quarter 2023 to June quarter 2026. Bars in slate denote a fall.
Which items, and where they sit
Each of the ten groups divides again, into 39 priced items in all. At that level the year’s fastest movers do not line up with the fastest groups. Copper pipes and fittings, up 25.1%, is the fastest-rising item in the index, and it sits inside other metal products, a group that rose 4.9% overall. Electrical cable and conduit, up 16.3%, is in electrical equipment. Plastic pipes and fittings, up 14.9%, is in plumbing products, and sand, up 11.2%, is in concrete, cement and sand, a group that rose 2.8%. The four fastest items in the index belong to four different groups.
The ten fastest-moving items, annual change, %, year to the June quarter 2026
Source: ABS 6427.0 Table 18, weighted average of six capital cities. These are the ten fastest of the 39 priced items, which sit beneath the ten material groups shown earlier.
That is why electrical equipment leads the groups without containing the fastest item. It leads on its slowest: each of its three items rose more than 8% over the year, and the next-highest slowest item, in cement products, rose 4.3%. Other metal products holds the 25.1% rise in copper pipes alongside metal roofing and guttering, which fell 2.0%.
Over the longer window two of them separate furthest from the rest: copper pipes and fittings are 58.0% above their March quarter 2023 level and electrical cable and conduit 32.6% above theirs, against 7.2% for the basket as a whole. The cable index stands at 272.4, the highest reading of any series quoted in this article and 2.7 times its 2011–12 level.
Both of those items are copper-intensive, and it is tempting to read the pair as a single commodity story. The index does not settle that on its own. Plastic pipes and fittings, which contain no copper, rose 14.9% over the same year, and switches and distribution boards rose 8.5%. The ABS names a cause for the latest quarter: it attributes the 11.2% quarterly rise in electrical cable and conduit to elevated copper and PVC costs, a plastic input alongside the copper one, which is consistent with what the item figures show.
Selected items and the all-groups index, index levels, 2018–2026
Source: ABS 6427.0 Table 18, weighted average of six capital cities. Shown in full: electrical cable and conduit, copper pipes and fittings, steel beams and sections, and the all-groups index. All four share the 2011–12 = 100 reference base, so the levels are directly comparable.
Steel going the other way
Steel products are the one group moving against the rest, and they have been for some time. The group’s index reached 163.4 in the September quarter 2022, its highest reading in the published series, and stands at 126.7 in the June quarter 2026, 22.5% below that point. Beneath the group, steel beams and sections are 19.7% lower than in the March quarter 2023 and reinforcing steel 12.7% lower.
The effect on the all-groups figure is to hold it down. Steel is one of ten groups and carries a fixed weight in the index, so a group falling 1.2% while the basket rises 3.8% subtracts from the total rather than adding to it.
What this measure does not settle
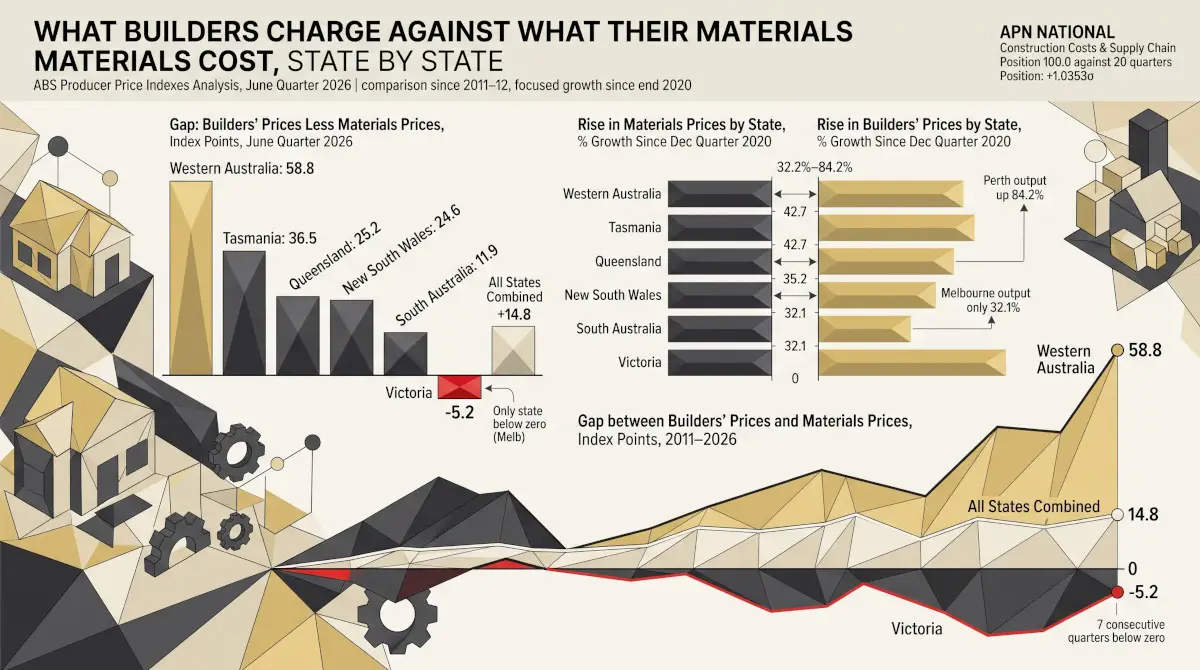
The limits are worth stating plainly. The index prices materials only, so nothing here speaks to the cost of on-site labour, which is a large share of what a house costs to build and moves on its own terms. It prices what builders pay rather than what they charge; the relationship between builders’ prices and the prices buyers of new homes face is a separate question, treated in a companion piece on builders’ and buyers’ prices.
The weights that combine the ten groups come from a 2019–20 bill of quantities for a representative house, so a change in what goes into a typical dwelling registers in the index only when those weights are next revised. And the capital-city collection means a materials price paid outside a capital enters the index only through its capital’s reading.
One thing the index does not measure at all is whether builders can absorb the change. That question belongs to a different measure: the count of construction firms entering external administration, which is tracked separately and feeds the same APN node as this price series.
Findings are presented on the basis of data and evidence alone.