On 29 September 2026 two things happened on the same day. The Reserve Bank raised the cash rate to 4.60%, and APN’s Interest Rates reading was recertified for the June quarter, lower than before: +0.9807σ, down from +1.0049σ in the March quarter. The recertified reading covers the three months to June, when the cash rate had also risen, to 4.35% in May. It still went down because the reading has four inputs, not one. The cash rate and the lending rate rose, but the two-year government bond yield fell by more than either of them rose, as markets scaled back how far they expected rates to go, and the share of new loans written at high multiples of income also fell. Together those two outweighed the rises.
The high debt-to-income input begins in March 2019, so it has fewer observations than the platform’s usual minimum for a baseline; that shorter history attaches to every reading of this node and limits the ranking to 30 quarters.
What the reading measures
Interest Rates (21210) measures the cost and availability of borrowing as set by policy, by lenders and by regulation. It combines four inputs with equal weight. The cash rate target is the Reserve Bank’s policy setting. The advertised standard variable rate shows how far that setting reaches the rate lenders quote. The two-year government bond yield carries the market’s pricing of where rates are expected to go. The share of new lending at six or more times the borrower’s income reflects how much highly leveraged lending is being written under the prudential settings of the day.
Each input is expressed as a standard score: how far its latest value sits from its own baseline average, in standard deviations. The reading is the average of the four scores, so a movement in any one input shifts the reading by a quarter of that input’s movement.
Why four inputs rather than the cash rate alone
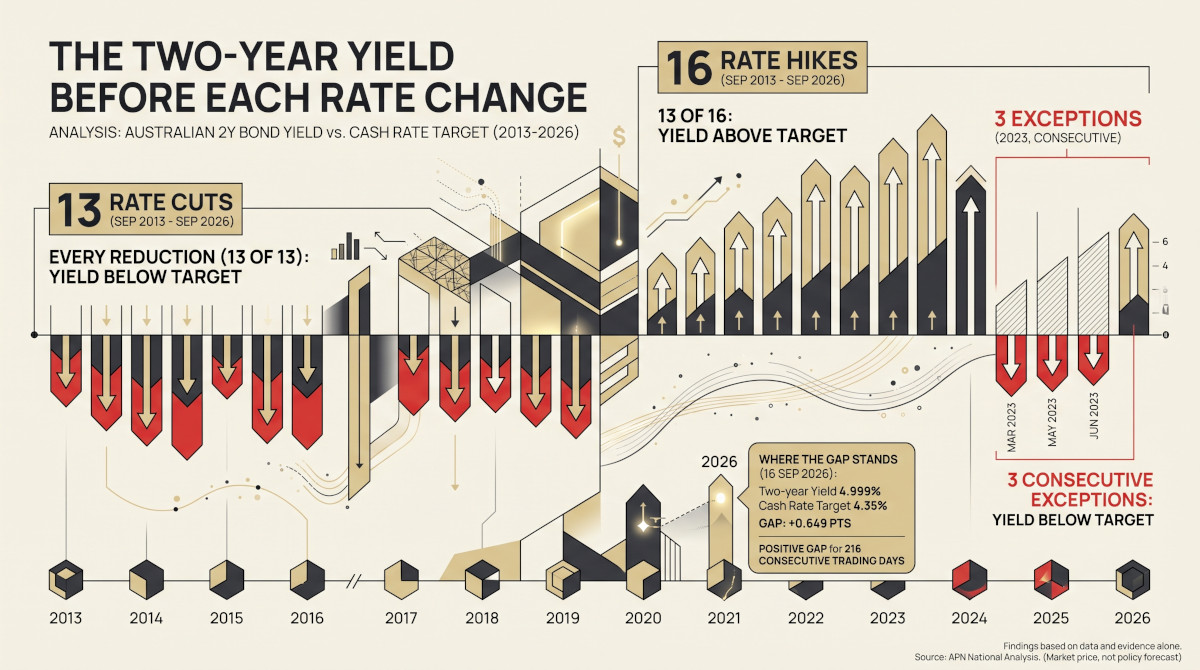
The cash rate changes on a handful of days a year. The other three inputs move between decisions: bond yields respond to shifts in what markets expect, lenders set their own rates, and the share of high-multiple lending responds to borrowing capacity and prudential limits. A reading built on the cash rate alone would show nothing between decisions and would leave out the market’s own view. How the two-year yield has behaved before each cash-rate change is set out in The Two-Year Yield Before Each Rate Change.
Each input’s standard score, March quarter 2019 to June quarter 2026
Standard score of each input by quarter, March quarter 2019 to June quarter 2026. The high debt-to-income series begins in March 2019. APN calculation based on Reserve Bank of Australia and Australian Prudential Regulation Authority data.
The June quarter, input by input
| Input | March quarter 2026 | June quarter 2026 | Standard score, March | Standard score, June | Change in contribution |
|---|---|---|---|---|---|
| Cash rate target | 4.10% | 4.35% | +1.1972 | +1.3688 | +0.043 |
| Advertised standard variable rate | 8.52% | 8.77% | +1.5978 | +1.7730 | +0.044 |
| Two-year government bond yield | 4.803% | 4.406% | +2.1740 | +1.8509 | −0.081 |
| Share of new lending at six or more times income | 6.20% | 5.40% | −0.9494 | −1.0697 | −0.030 |
| Interest Rates (21210) | +1.0049 | +0.9807 | −0.024 |
Each input’s standard score is its distance from its own baseline average in standard deviations; each carries a weight of 0.25, so its contribution to the change is a quarter of the change in its score. Levels are the last observation in each quarter. APN calculation based on Reserve Bank of Australia (Tables F1, F2 and F5) and Australian Prudential Regulation Authority (Quarterly ADI Property Exposures, June 2026) data.
What moved the reading between the March and June quarters of 2026
Change in each input’s weighted contribution, March quarter to June quarter 2026. Interest Rates (21210). APN calculation based on Reserve Bank of Australia and Australian Prudential Regulation Authority data.
The cash rate target rose from 4.10% at the end of March to 4.35% at the end of June, adding +0.043 to the reading. The advertised standard variable rate rose the same 0.25 of a point, from 8.52% to 8.77%, adding +0.044. Together they added +0.087.
Against that, the two-year government bond yield fell from 4.803% to 4.406%, taking 0.081 off the reading, and the share of new lending at six or more times income fell from 6.20% to 5.40%, taking off 0.030. The net change was −0.024, from +1.0049σ to +0.9807σ.
What the bond yield was pricing
A two-year yield reflects, in large part, the market’s expectation of the cash rate over the next two years. At the end of March its standard score was the highest in the period shown, since 2019. By the June meeting that expectation had eased. The minutes of the Reserve Bank’s Monetary Policy Board meeting of 16 June 2026 note that market participants’ expectations for the future path of monetary policy had eased noticeably since May, in response to lower global oil prices and weaker-than-expected April data for both the labour market and headline inflation in Australia. Pricing then implied a 50 per cent chance of one more 0.25-point increase by the end of 2026, having priced about 0.40 of a point of further increases immediately after the May meeting.
The Reserve Bank’s August 2026 Statement on Monetary Policy describes the same move: Australian government bond yields were slightly lower than at the time of the May Statement, alongside a decline in the market path for the cash rate and lower inflation compensation at the shorter end. On the Reserve Bank’s account, most of the fall reflected a lower expected path for the cash rate.
Where the reading sits
Interest Rates (21210) reading by quarter
Quarters in which all four inputs are present, March quarter 2019 to June quarter 2026. Interest Rates (21210). APN calculation based on Reserve Bank of Australia and Australian Prudential Regulation Authority data.
Even after easing, the June quarter reading of +0.9807σ ranks 96.6 against the 30 quarters in which all four inputs are present, second only to the March quarter 2026. Interest Rates is also a component of the APN Aggregate Macro-Volatility Index™ (21200), the Economic Factors composite, where it carries a weight of 0.20; the June quarter certification moved that composite from +0.9619σ to +0.9570σ.
Where the September increase comes in
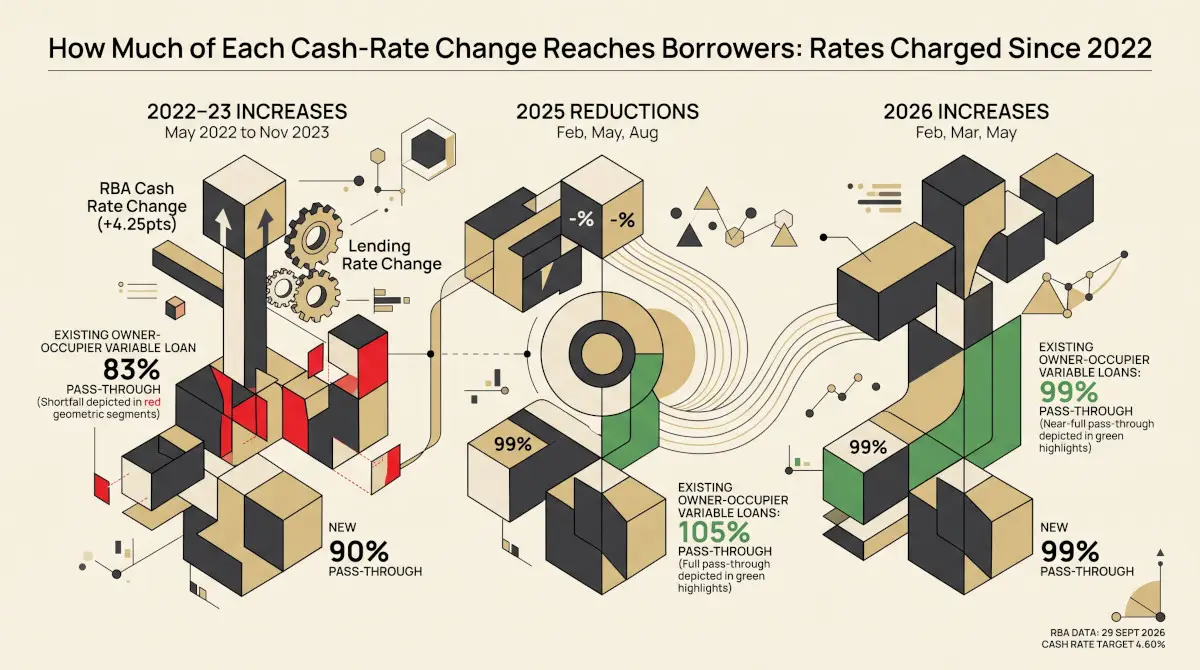
The 4.60% cash rate is not in the recertified reading, which ends in June. It took effect on 30 September, the last day of the September quarter, and because each input takes its last value in the quarter, the cash-rate input for the September quarter will be 4.60%. On its own, that lifts the input’s standard score from +1.3688 to +1.5404, which adds +0.043 to the reading. Whether the September quarter reading ends up higher or lower depends on the other three inputs, as the June quarter showed: the lending rate, the two-year yield and the high debt-to-income share take their September quarter values once those data are published, the last of them by APRA in December. How lenders have passed on past changes is covered in How Much of Each Cash-Rate Change Reaches Borrowers.
What this does not show
A standard score describes where an input sits against its own history; it is not a forecast and does not say whether a level is too high or too low. The four inputs are weighted equally by design, which is a choice about the construction of the reading, not a finding about which matters most. The high debt-to-income series begins in 2019, so its baseline is short, and the reading can be ranked against 30 quarters only. The lending rate used is the advertised rate, not the average rate charged.
- Australian Prudential Regulation Authority Quarterly authorised deposit-taking institution property exposures statistics, June 2026 (released 17 September 2026) [https://www.apra.gov.au/quarterly-authorised-deposit-taking-institution-property-exposures-statistics], accessed 30 September 2026.
- Reserve Bank of Australia Cash Rate Target: changes and effective dates [https://www.rba.gov.au/statistics/cash-rate/], accessed 30 September 2026.
- Reserve Bank of Australia Minutes of the Monetary Policy Board Meeting, 16 June 2026 [https://www.rba.gov.au/monetary-policy/rba-board-minutes/2026/2026-06-16.html], accessed 30 September 2026.
- Reserve Bank of Australia Statement on Monetary Policy – August 2026: Financial Conditions [https://www.rba.gov.au/publications/smp/2026/aug/financial-conditions.html], accessed 30 September 2026.
- Reserve Bank of Australia Statistical Tables F1 (cash rate target), F2 (government bond yields) and F5 (indicator lending rates) [https://www.rba.gov.au/statistics/tables/], accessed 30 September 2026.
Reserve Bank of Australia material is used under a Creative Commons Attribution 4.0 International licence. Standard scores, contributions and index readings are APN’s and are not attributable to the Reserve Bank or APRA.
Findings are presented on the basis of data and evidence alone.