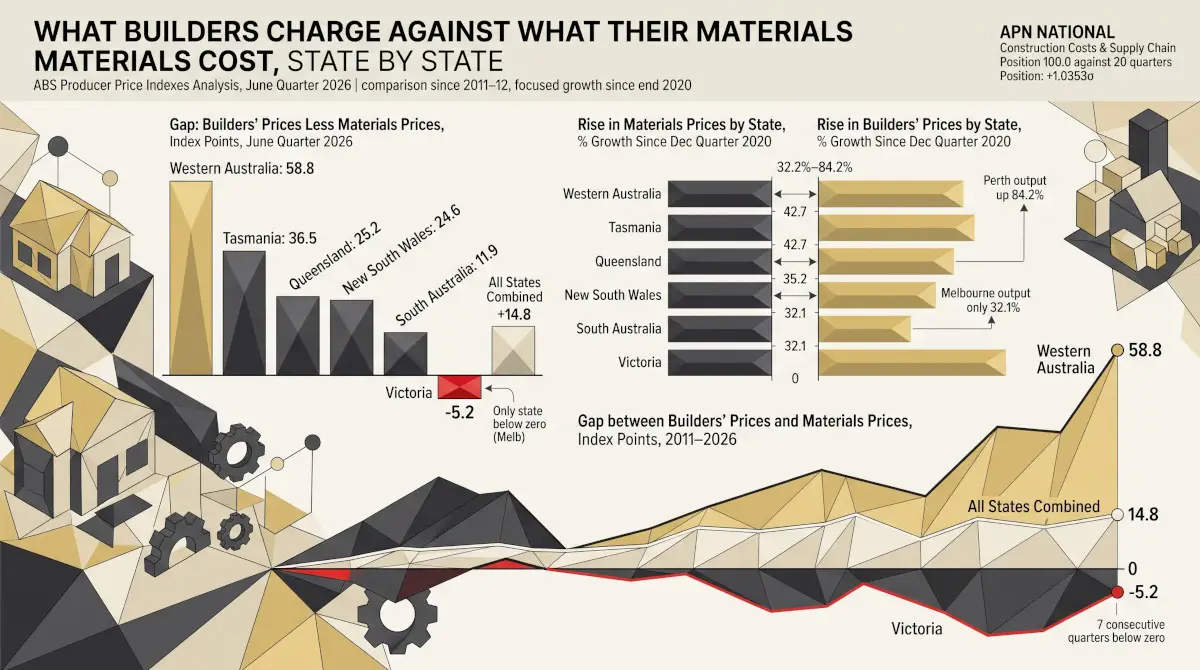

Since the end of 2020 the materials that go into a new house have risen in price by between 35.2% and 42.7% in every one of the six state capitals, a band of 7.5 percentage points. What builders charge for the finished house has not moved together at all: 32.1% in Melbourne, 84.2% in Perth. The difference between states sits almost entirely in the prices builders charge, not in what their materials cost. Western Australia’s builders’ prices have run furthest ahead of materials, 58.8 index points since 2011–12. Victoria is the only state where they have fallen behind.
The σ figure is APN’s certified reading for construction cost and supply chain conditions: how far they sit from their 2011–2025 average, measured in standard deviations. The position ranks the reading against the 20 comparable quarters since the September quarter 2021, and at 100.0 it is the highest of them. The state comparison in this article is one of that reading’s four inputs. The price figures here are published ABS data and are not the node reading.
Two price indexes, and what the difference between them is
The Australian Bureau of Statistics publishes two producer price indexes for house building. The output index prices what a builder receives for constructing a new detached house: the selling price, covering every production cost and the builder’s margin, and including any grants, rebates or subsidies the buyer receives. The input index prices the materials that go into the house, and nothing else — no labour, no subcontractors, no overheads.
Both are compiled from prices in the six state capitals, each standing for its state, and both are set to 100 across the 2011–12 financial year. That shared starting point is what makes them comparable. Because each began at 100, the difference between them in index points is the difference in how far each has risen since 2011–12, in percentage points: a gap of 20 means builders’ prices have risen 20 percentage points more than materials prices since then.
The gap is not a margin, and it should not be read as one. The output price carries labour, subcontractor rates and overheads as well as the builder’s margin, so a widening gap can mean any of those rising faster than materials, and the index cannot tell them apart. Nor does it say anything about how wide margins were in 2011–12: both indexes start at 100 whatever the margin was then. What the gap measures is movement — how far what builders charge has travelled against what their materials cost, from a common start.
Where the gap stands
In the June quarter 2026 builders’ prices stood ahead of materials prices in five of the six states. Western Australia’s gap was the widest by some distance at 58.8 index points, ahead of Tasmania at 36.5. Victoria’s was −5.2: since 2011–12 the price of building a house in Melbourne has risen slightly less than the price of the materials that go into it. For all states combined the gap was 14.8.
Builders’ prices less materials prices, index points, June quarter 2026
Source: ABS 6427.0 Producer Price Indexes, Table 17 (Output of the Construction industries, class 3011 House construction) less Table 18 (Input to the House construction industry, all groups), original series, 2011–12 = 100. Bars in slate denote a gap below zero.
| State | Priced in | Gap, Jun 2026 | Prices since Dec 2020 | Materials since Dec 2020 | Prices, year to Jun 2026 | Materials, year to Jun 2026 |
|---|---|---|---|---|---|---|
| Western Australia | Perth | 58.8 | 84.2% | 41.4% | 8.8% | 3.9% |
| Tasmania | Hobart | 36.5 | 63.5% | 40.1% | 11.5% | 3.4% |
| Queensland | Brisbane | 25.2 | 57.6% | 42.7% | 8.0% | 4.4% |
| New South Wales | Sydney | 24.6 | 40.6% | 35.2% | 4.8% | 3.5% |
| South Australia | Adelaide | 11.9 | 63.8% | 40.5% | 8.5% | 4.4% |
| Victoria | Melbourne | −5.2 | 32.1% | 39.5% | 3.7% | 3.5% |
| All states | Combined | 14.8 | 47.0% | 39.3% | 5.9% | 3.8% |
Materials moved together; builders’ prices did not
The clearest way to see where the differences between states come from is to take the two indexes apart. Since the December quarter 2020, the last quarter before the 2021–22 rise in building costs began, materials prices have risen by between 35.2% in Sydney and 42.7% in Brisbane. Across six capitals spread over a continent, that is a narrow band, and it is consistent with materials being priced largely in one national market.
Builders’ prices over the same period rose by between 32.1% in Melbourne and 84.2% in Perth — a band about seven times as wide. Victoria is the only state where they rose less than materials. Everywhere else they rose more, and in Western Australia by about twice as much.
Rise in materials prices by state, December quarter 2020 to June quarter 2026, %
Source: ABS 6427.0 Table 18, all groups, by capital city. States are in the same order as the chart below, and both charts share one scale.
Rise in builders’ prices by state over the same period, %, on the same scale
Source: ABS 6427.0 Table 17, class 3011 House construction, by state, priced in the capital city.
Set side by side on the same scale, the two charts carry the finding. The materials bars are close to the same length; the price bars are not. Whatever has separated the states since 2020, it did not arrive through the price of materials.
How the gap moved
The present spread between states is recent. As late as the June quarter 2020 Western Australia’s gap was −3.3, below zero; in the March quarter 2019 it had been −5.9. It widened in two stages. The first came with the 2021–22 rise in building costs, taking the gap to 19.3 by the September quarter 2022 before it eased to 12.5 in the June quarter 2023. The second, and much the larger, came afterwards: from the June quarter 2023 the gap more than quadrupled, to 58.8. That second stage came while materials price growth was returning to normal. Western Australia has held the widest gap of the six states in each of the last ten quarters, and shared it with New South Wales in the quarter before.
Victoria has moved the other way. Its gap has been the narrowest of the six in every quarter since the March quarter 2023, and it has been below zero for seven consecutive quarters, the last reading at or above zero being the September quarter 2024.
Builders’ prices less materials prices, index points, 2011–2026
Source: ABS 6427.0 Tables 17 and 18. Western Australia and Victoria, the widest and narrowest gaps in the June quarter 2026, against all states combined. The dotted line marks zero, where both indexes have risen equally since 2011–12.
Builders’ prices and materials prices in Western Australia and Victoria, index levels, 2011–2026
Source: ABS 6427.0 Tables 17 and 18, priced in Perth and Melbourne, 2011–12 = 100. Solid lines are builders’ prices; dashed lines are materials.
The two states’ own indexes show where that difference sits. Their materials lines run close together throughout. Their price lines do not: Perth’s climbs away from its materials line, most steeply from 2023, while Melbourne’s has stayed within seven points of its own in every quarter since 2011–12.
The past year
Over the year to the June quarter 2026 the same pattern held at a smaller scale. Materials prices rose by between 3.4% and 4.4% in every capital. Builders’ prices rose by 3.7% in Melbourne, the slowest, and 11.5% in Hobart, the fastest, with Perth at 8.8%.
What this measure does not settle
The gap measures movement, not margin, for the reasons set out at the start: the output price carries labour, subcontractors and overheads as well as margin, and neither index says anything about levels in 2011–12. A state whose gap has widened may have seen its labour costs rise, its builders’ margins widen, or both; these indexes cannot separate them, and what drove each state’s movement is NIL RETURN from this source.
The output price includes grants, rebates and subsidies the buyer receives, so a change in a state’s own grant settings can register in it independently of building costs. Both indexes are priced in the capital city, so a regional builder’s experience enters only through the capital’s reading. The Northern Territory and the Australian Capital Territory have output indexes but no capital-city materials index, so they are not compared here.
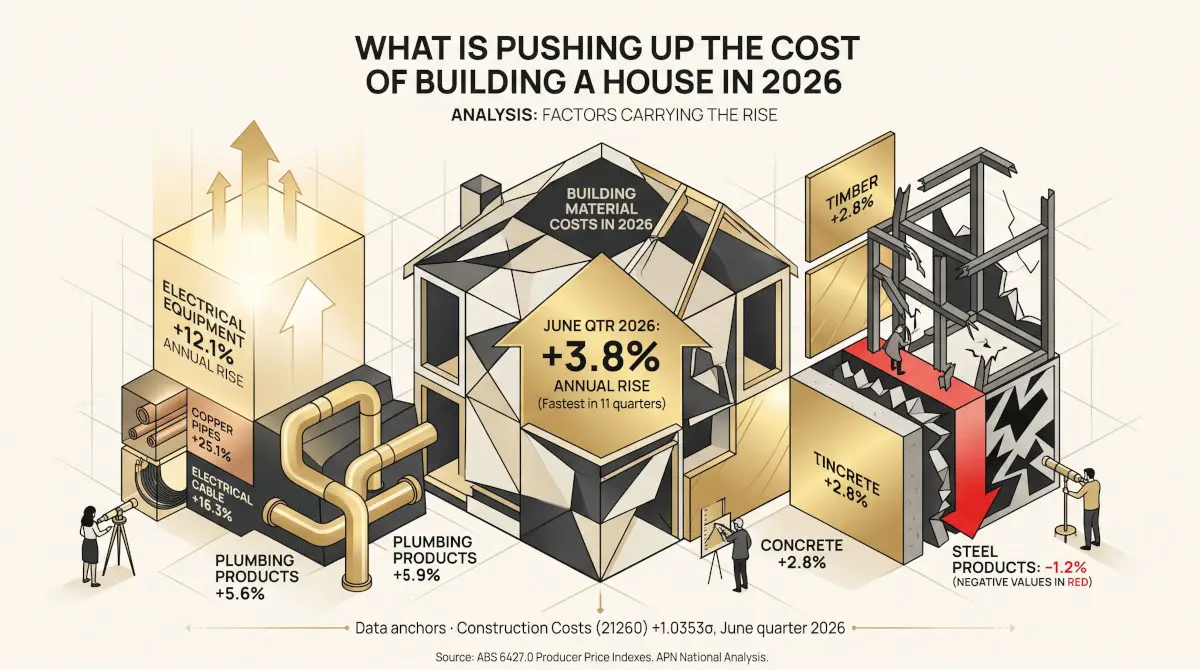
The national materials picture — which materials have driven the rise, and how that differs from the 2021–22 period — is a separate question from this state comparison. How builders’ prices relate to the prices buyers of new homes pay is treated in a companion piece on builders’ and buyers’ prices, and whether builders are absorbing the change is a question for the count of construction companies entering administration.
Findings are presented on the basis of data and evidence alone.