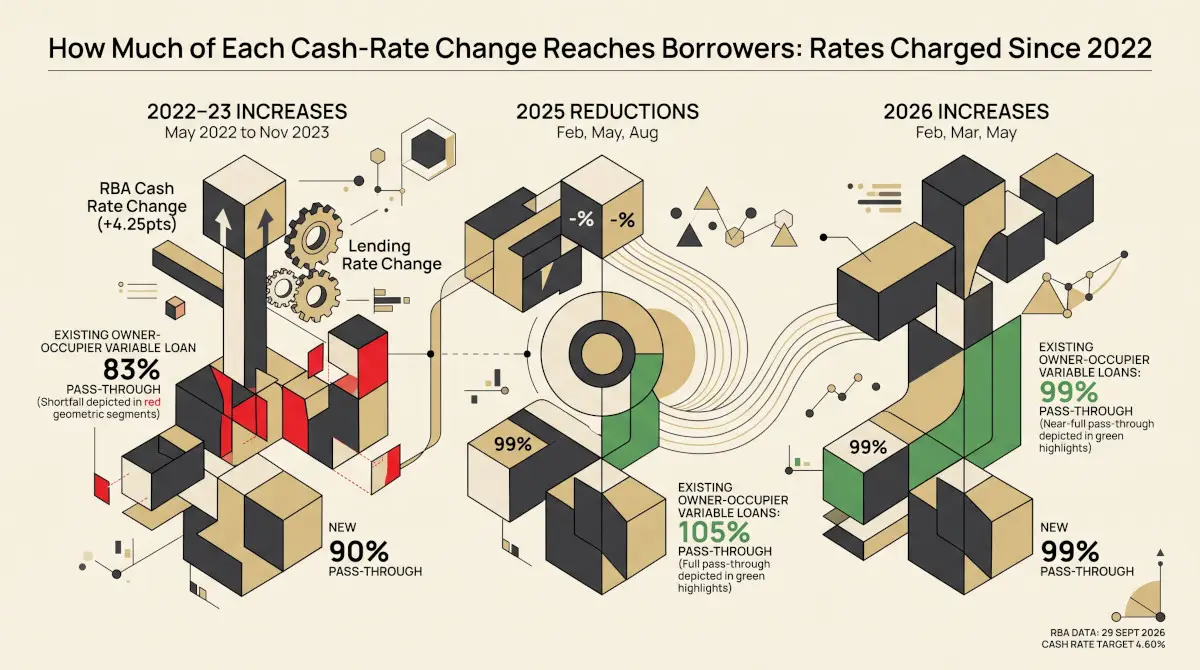
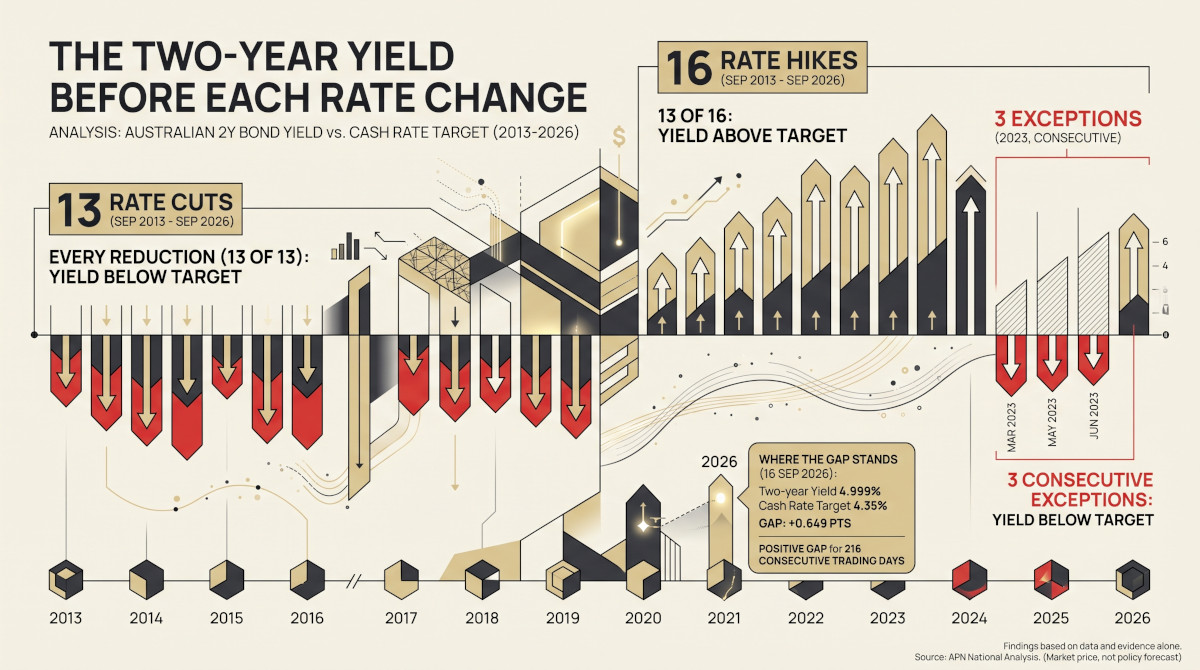
The advertised standard variable home-loan rate has sat exactly 4.42 percentage points above the cash rate target in 67 of the 69 months since November 2020. It is a reference rate rather than a price, and because it moves point for point with the cash rate it carries almost no information the cash rate does not already carry. The rates borrowers are actually charged behave differently. The average variable-rate owner-occupier loan funded in July 2026 was priced at 6.24 per cent — 1.89 points above the cash rate, and 2.53 points below the advertised one.
The node composes four inputs: the cash rate target, indicator lending rates, the two-year government bond yield and the share of new lending written at high debt-to-income multiples. The last of these begins in March 2019 and has fewer observations than the platform’s minimum for a baseline estimate, a disclosure that attaches to every reading of this node; it is also what confines the ranking population to 29 quarters. The reading is the node’s highest across those quarters.
Two rates, and only one of them moves on its own
The Reserve Bank publishes home-loan interest rates in two places, and they answer different questions. Table F5, Indicator Lending Rates, reports rates lenders quote — the average, across large lenders, of the rate advertised for a given product. Table F6, Housing Lending Rates, reports rates borrowers are charged, compiled from returns lenders make to the Australian Prudential Regulation Authority and weighted by the value of the loans themselves.
The quoted standard variable rate is a reference point rather than a price. The Reserve Bank publishes a discounted rate alongside it, defined as the rate offered on standard variable loans as part of a professional package, and that rate is set at a margin below the standard one. The standard rate has moved in step with the cash rate for more than five years. Since November 2020 it has stood 4.42 points above the target in 67 of 69 months. The two exceptions both read 4.52 points, in February and May 2025, and behaved identically: a reduction of 0.25 took effect part-way through the month, the advertised rate had moved 0.15 of it by the last working day, and the remaining 0.10 arrived the month after, returning the gap to 4.42 points.
The cash rate target and the advertised standard variable rate, 2011 to 2026
Sources: Reserve Bank of Australia, cash rate target (Tables F1 and F4) and Indicator Lending Rates (Table F5), owner-occupier standard variable. Monthly, the target as in force on the last day of each month.
That relationship was not always fixed. In January 2011 the advertised rate stood 3.04 points above the target. It widened in steps through the decade that followed, reaching 4.42 points in November 2020 — 1.38 points of widening over ten years. Two things produced it, and both are nets. In months the target was reduced, partial passthrough widened the gap by 1.02 points against 0.02 given back, a net 1.00. In months the target did not move at all, the advertised rate rose by 0.46 and fell by 0.08, a net 0.38, the largest single rise being 0.17 of a point in November 2015. Since November 2020 neither has left a mark: the gap has returned to 4.42 points after each of the two exception months, and the widening has not resumed.
The gap between the advertised standard variable rate and the cash rate target
Percentage points. Sources: Reserve Bank of Australia Tables F1, F4 and F5. The flat run from November 2020 is the advertised rate moving one-for-one with the target.
The same holds on the investor side, and just as tightly. The advertised standard variable investor rate has sat 5.00 points above the target in 67 of the same 69 months, and the two exceptions are the same two months, each reading 5.10.
Five rungs between the policy rate and the borrower
Between the cash rate and what a household pays there are several published rates, each measuring something different. Setting them out at a single date shows the distance involved.
| Rate | Owner-occupier | Above cash rate | Investor | Above cash rate |
|---|---|---|---|---|
| Advertised standard variable rate | 8.77% | 4.42 | 9.35% | 5.00 |
| Advertised discounted variable rate | 6.80% | 2.45 | 7.13% | 2.78 |
| Advertised three-year fixed rate | 6.74% | 2.39 | 6.82% | 2.47 |
| Average charged, new variable loans | 6.24% | 1.89 | 6.40% | 2.05 |
| Average charged, outstanding variable loans | 6.24% | 1.89 | 6.48% | 2.13 |
July 2026. Cash rate target 4.35 per cent. Differences in percentage points. Sources: Reserve Bank of Australia Tables F5 and F6.
The discounted rate is the one offered on standard variable loans as part of a professional package; where a lender tiers its pricing by loan size, the Reserve Bank uses the rate applying to a loan of $250,000 or more. It sat 6.80 per cent for owner-occupiers, 1.97 points below the advertised standard rate.
Below that again are the rates actually charged. New variable-rate owner-occupier loans funded in July 2026 averaged 6.24 per cent, and the existing stock of such loans the same 6.24 per cent. Both sit 1.89 points above the cash rate — a little over two-fifths of the 4.42-point distance the advertised rate implies.
Quoted and charged: owner-occupier variable rates since July 2019
Four lines, owner-occupier: the advertised standard variable rate (solid gold), the advertised discounted variable rate (dashed gold), the average rate charged on new variable loans funded in the month (charcoal) and the cash rate target (slate). Sources: Reserve Bank of Australia Tables F1, F4, F5 and F6. The F6 series begin in July 2019; the advertised discounted series carries a break in June 2019 and is shown only from July 2019 for that reason.
What moved across the tightening cycle
The cash rate target rose 4.25 points between April 2022, the last month before the cycle began, and July 2026, first reaching the present level in November 2023, then three reductions through 2025 and three increases since. Measuring each rate across the same window separates the ones that track the target from the ones that do not.
Change in each rate, April 2022 to July 2026
Percentage points. Sources: Reserve Bank of Australia Tables F1, F4, F5 and F6. April 2022 is the last month before the first increase of the cycle, which took effect on 4 May 2022.
Both advertised standard rates rose by 4.25 points, which is the movement in the cash rate itself, to the cent. Every rate actually charged rose by less: between 3.27 and 3.83 points.
The three-year fixed rate shows the smallest rise on that chart, 2.40 points, and the figure should not be read as the cash rate reaching it more weakly than the others. A fixed-rate loan is funded at the wholesale cost of money over a matching term, so its price follows market yields rather than the cash rate, and it had already begun to rise before the cash rate did. Between October 2021 and April 2022 the advertised three-year fixed rate rose 1.87 points while the target sat unchanged at 0.10 per cent. Measured from October 2021 instead, it rose 4.27 points to July 2026 — the same movement as the cash rate, to within two hundredths of a point. April 2022 is the right starting month for a rate that follows the cash rate and a late one for a rate that does not.
That difference runs through the whole published history. In the 122 months since January 2014 in which the cash rate did not change at all, the advertised three-year fixed rate moved in 53 of them and the advertised standard variable rate in 12. Two instruments, two sources of funding, one of which the Reserve Bank sets. The structural spread and the two-instrument regime sets out the funding pathway in full.
The consequence is that the distance between the cash rate and what borrowers pay has closed, even as the level of both rose. In April 2022 a new owner-occupier variable loan was priced 2.31 points above the target; in July 2026, 1.89 points. For the existing stock the narrowing is wider still, from 2.76 points to 1.89.
New and existing owner-occupier rates have converged
Through the low-rate years a borrower taking out a new variable loan paid measurably less than one already holding the same kind of loan. In April 2022 the difference was 0.45 of a percentage point, and it reached 0.51 points in October 2022, the widest in the series.
It has closed since, and stayed closed. The gap was last above 0.20 of a point in August 2023, last above 0.10 in April 2024 and last above 0.05 in April 2025. In every one of the 13 months from July 2025 to July 2026 it has been 0.03 of a point or less, and in four of those — January, May, June and July 2026 — the two averages were identical to the second decimal place. A gap of one or two hundredths is inside the rounding of the published figures, so what the series supports is that the two rates now sit together, not that they are exactly equal in any particular month.
On the investor side a difference remains, though a smaller one than before: new investor loans were priced 0.16 of a point above new owner-occupier loans in July 2026, against 0.30 in April 2022 and 0.40 in July 2019.
One further comparison is available because the cash rate has made a round trip. The target stood at 4.35 per cent in January 2025, was reduced three times to 3.60 per cent, and returned to 4.35 per cent in May 2026. New owner-occupier variable loans averaged 6.25 per cent at the start of that journey and 6.24 per cent at the end, with a low of 5.49 per cent in November 2025. The stock outstanding ended 0.07 of a point lower than it began.
What these measures do not show
They do not describe any individual loan. Both tables are averages across lenders, and the charged rates are weighted by loan value, so a large loan counts for more than a small one. A borrower’s own rate depends on the lender, the size of the loan, the share of the property’s value being borrowed and what was negotiated; none of that is visible in an average.
On the charged side they cover variable-rate lending only. Fixed-rate loans written during 2020 and 2021 are not in either charged series, and the expiry of those fixed terms moved borrowers into the variable pool at rates set years after they first borrowed. The advertised three-year fixed rate in the table is a quoted rate, not a charged one, and is not comparable with the two charged series beside it. It is also priced off a different instrument: its distance from the cash rate is the gap between two funding bases rather than a margin any lender sets, so it is the one row in the table for which that column is not a lending decision.
They are not a measure of what a household can borrow, which turns on the rate a loan is tested at rather than the rate it is priced at, nor of what a household can afford to repay. And the Reserve Bank describes the rates in both tables as indicative and subject to revision; F6 is not adjusted for breaks in its reporting population, and the advertised discounted series carries a break in June 2019.
Related reading: The Cost of Money and the Cost of Housing, which sets the advertised standard variable rate against its fifteen-year average alongside other measures, The Structural Spread, the DTI Ceiling, and the Two-Instrument Regime, which sets out how a fixed-rate book is funded and why that rate can move when the cash rate has not, and an attributed perspective on bond yields and Australian mortgage rates.
Findings are presented on the basis of data and evidence alone.