Ten Thousand Fewer or Thirty Thousand More: What Separates the Two Housing Package Models
New Housing Supply Forecasts (21520) +1.6228σ Q1 2026 · position 100.0, ranked against 167 quarters
Building Approvals & Commencements (21510) +0.0034σ Q1 2026 · position 80.0, ranked against 171 quarters
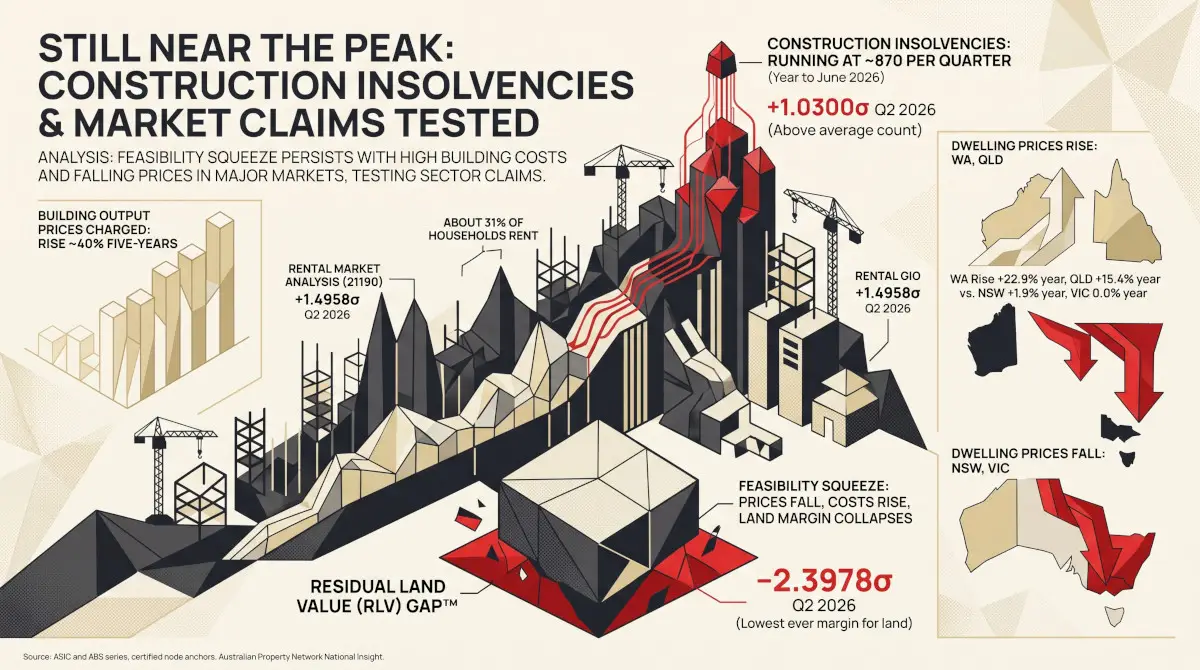
Rental Market Analysis (21190) +1.4816σ Q2 2026 · indicative position 93.1, empirical ranking begins at 20 quarters (currently 12)
Scope and Purpose
On 11 September 2026, the Housing Industry Association, Master Builders Australia, the Property Council of Australia and the Real Estate Institute of Australia released updated modelling of the 2026 Budget housing package by Qaive and Tulipwood Economics. Its headline is that the package will reduce new dwelling starts by about 10,700 and raise rents by about $10 a week by 2029–30. The Budget itself says the same package will support up to 30,000 new homes over the next decade. The two figures are cited against each other as if one of them must be wrong. This output reads both at their primary sources: the modellers’ briefs of 27 May and 3 September, and Budget Paper No. 1, Statement 4. It reports where the claims hold, where they hold with qualification, and where they cannot yet be tested. Australian Property Network’s (APN’s) earlier output Dating the Supply Decline established that Treasury’s 35,000 is a ten-year figure; that finding is not repeated here. The short answer is that the two models agree on what the tax changes do to dwelling numbers and part company on one line item, the infrastructure fund; on rents they also differ, over an assumption about pass-through.
Proposition One: The Package Cuts 10,700 New Homes
The figure is accurately reported, and its scope is narrower than the headline. The September brief sums four years, 2026–27 to 2029–30, and the annual shortfall rises through the period, from 1,424 starts in the first year to 3,851 in the fourth. It combines three measures: the negative gearing and capital gains changes, the $2 billion infrastructure fund, and the ban on self-managed super funds borrowing to buy residential property, which Labor and the Greens agreed to secure the package’s passage. The ban alone accounts for 1,951 of the 10,693. The claim holds as a modelled result for those three measures over four years; it is not a decade figure and not an observed one.
The more consequential detail is in the May brief. Modelled on their own, the tax changes reduce starts by 14,032 over the four years, which the authors describe as “almost identical” to Treasury’s modelling. Their comparison takes four-tenths of Treasury’s ten-year 35,000, about 14,000; that is the modellers’ straight-line assumption, not a Treasury path; Budget Paper No. 1 does not publish an annual profile. Even so, on the effect of the tax changes, the industry modelling and Treasury give the same answer.
Two Models of the Same Package: Effect on New Dwellings
Sources: Qaive and Tulipwood Economics, modelling briefs of 27 May and 3 September 2026 (dwelling starts, sum of four years); Budget Paper No. 1 2026–27, Box 4.4 (dwellings over the next decade). One axis, thousands of dwellings. The two groups cover different periods, four years against ten, and are not directly comparable.
Proposition Two: Up to 30,000 Additional Homes
The Budget’s 30,000 is a net figure and a ceiling. Budget Paper No. 1 sets roughly 35,000 fewer dwellings from the tax changes against “up to 65,000” new homes from the $2 billion Local Infrastructure Fund, and describes the result as support for “up to 30,000 new homes over the next decade”. The same page records that further planning, zoning and productivity reforms will be required of the states and territories as part of the fund. Budget Paper No. 1 does not set out the method behind the 65,000. The claim cannot be tested from the published record, and it depends entirely on the fund: without it, the Budget’s own figures show a net reduction.
The industry modelling puts the same fund at 5,291 additional starts over four years, against the 26,000 its authors derive by taking four-tenths of the 65,000. The modellers describe their own figure as a maximum, because they assume the full $2 billion passes into lower construction costs and allow for none of the land, labour and approval constraints that would slow it. Most of the difference between “10,700 fewer” and “30,000 more” is the yield of one $2 billion fund. Set over the same four years, about 20,700 of the 22,700-dwelling gap is the fund; the SMSF borrowing ban, which the Budget figure does not include, accounts for most of the rest. One model gives it a little over 5,000 dwellings in four years; the other up to 65,000 in ten, conditional on reforms the Commonwealth does not control.
Proposition Three: Rents About $10 a Week Higher
Here the models do disagree. The industry brief has rents 1.69% higher by 2029–30 under the full package, which on the $600 a week rent the modellers use is about $10. Treasury expects an increase of “less than $2 per week” for a household on the median rent, and does not state the year to which the figure applies. In their May brief, the modellers put the first-year rent effect of the tax changes about 50% above Treasury’s figure, widening to five times by 2029–30; both comparisons apply Treasury’s undated figure of about $2 to the year in question. The gap turns on an assumption the brief states openly: that landlords absorb about 60% of the lost after-tax return and pass about 40% to tenants. Both figures are modelled, the difference is real, and it rests on a pass-through assumption that the published material does not test against Australian evidence.
The base both models apply their percentage to is itself moving. Rental Market Analysis (21190) reads +1.4816σ for the June quarter 2026, with the national median weekly rent across the five reporting states at $695.15. On that base, 1.69% is about $11.75 a week rather than $10. The node’s baseline holds only 12 quarters, so the reading is disclosed as short-baseline and its position is indicative.
What the Models Also Say About Prices
One result runs against the way the industry modelling has been read. Treasury expects prices to grow by about 2% less over a couple of years, worth about $19,000 to a buyer at the national median. The industry model finds a smaller effect: established home prices 0.78% lower by 2029–30 under the full package. On prices, the industry modelling offers first home buyers less relief than the Budget claims, not more. Neither figure bears on the supply question, but a reader weighing the package on affordability should hold both.
APN Analytical Synthesis
The two models of the 2026 housing package are closer than their headlines. On the tax changes, the industry’s 14,032 fewer starts over four years and Treasury’s 35,000 over ten are, on the modellers’ own reading, the same estimate. The dispute is about what a $2 billion infrastructure fund can deliver, a question on which the Budget publishes a ceiling without a method and the industry publishes a figure it calls a maximum. The rent dispute is a dispute about pass-through. Neither the 10,700 nor the 30,000 should be cited as a fact about supply; each is the tax effect plus an assumption about the fund, and the industry figure also carries the SMSF ban.
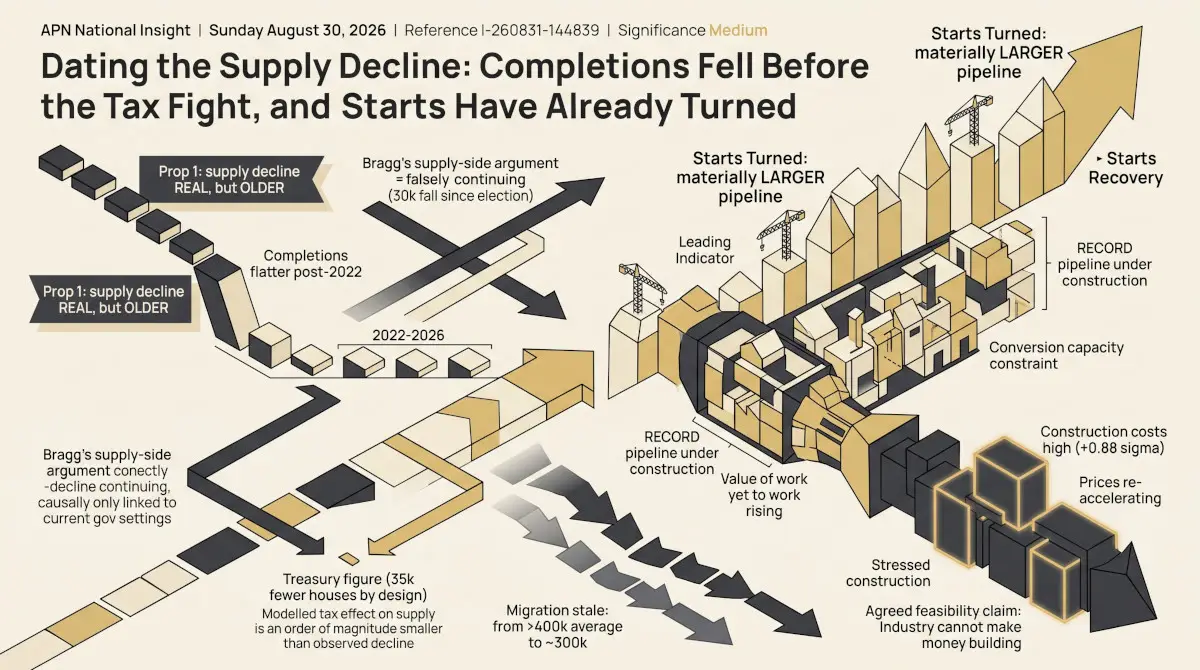
The observed pipeline is where the question will be settled. New Housing Supply Forecasts (21520) reads +1.6228σ for the March quarter, the highest of its 167 full-coverage quarters, while Building Approvals & Commencements (21510) sits at +0.0034σ, at its 2011–2025 norm, though above most of its longer history (position 80.0 of 171). The pipeline is full; the flow of new approvals and starts is at its recent norm. The tax changes apply from 1 July 2027. The June-quarter Building Activity release on 7 October 2026 will extend the commencements series; any effect of the package will appear later than that. This synthesis speaks only to what the cited data and published modelling can independently support; it does not constitute a view on future dwelling volumes, rents, prices or policy, and no such view is expressed or implied.
Disclaimer
The analysis and information contained in this publication are for general informational and strategic purposes only and do not constitute financial, investment, legal, or any other form of professional advice. Australian Property Network is not a licensed financial advisor. Property values and market conditions can go up or down. Before making any property or investment decisions, you must conduct your own thorough research and seek independent professional advice tailored to your specific circumstances.