The Final Budget Outcome Claims Tested: Demand, Unemployment, Productivity and Migration
Chalmers and Gallagher: A Smaller Deficit, and an Inflation Challenge Made Worse Abroad (O-260928-151292-MEDIUM)
Employment & GDP (21230) +0.5947σ Q2 2026 · position 94.7, ranked against 58 quarters
Inflation (21220) +2.1049σ Q2 2026 · position 100.0, ranked against 22 quarters
Migration Trends (21250) +1.0390σ Q1 2026 · position 86.7, ranked against 61 quarters
Scope and Purpose
On 28 September 2026 the Treasurer, Jim Chalmers, and the Minister for Finance, Katy Gallagher, released the Final Budget Outcome for 2025–26. Their account is carried in the companion Government output, Chalmers and Gallagher: A Smaller Deficit, and an Inflation Challenge Made Worse Abroad. Alongside the budget figures, which are the government’s own, they made six claims about the economy that can be tested against ABS data: that public demand grew at its slowest in 11 years; that four in every five dollars of demand was private; that the government has presided over the lowest average unemployment of any government in 50 years; that the decade before it had the weakest productivity growth in 50 or 60 years; that wages are growing above 3%; and that net overseas migration is almost 50% below its post-COVID peak. The short answer is that five of the six hold, one of them only as a share of growth rather than of the level of demand, and the productivity claim does not hold on either the whole-economy or the market-sector measure.
The Budget Result
The Final Budget Outcome was reported as an underlying cash deficit of A$22.3 billion for 2025–26, about 0.8% of GDP, against A$28.3 billion forecast in May (Reuters, which gives the figure in US dollars as $15.7 billion) — the $6 billion improvement the Treasurer described. The deficit is smaller than forecast, and larger than the A$10.0 billion recorded in 2024–25. The ministers’ figures for debt, real spending growth, savings and the share of revenue upgrades returned to the budget are the government’s own and are not tested here.
Claim One: Public Demand Grew at Its Slowest in 11 Years
The claim holds. Measured as government consumption plus public investment in volume terms, public final demand grew 2.2% in 2025–26. The last year of slower growth was 2014–15, at 0.6%, eleven years earlier. Growth had run between 3.6% and 6.8% in every year from 2015–16 to 2021–22, and above 4% in the two years before 2025–26. Public demand is now growing more slowly than it has for a decade.
Growth in Public Final Demand, by Financial Year, 2012–13 to 2025–26
Source: ABS Australian National Accounts (5206.0), Table 2, chain volume measures, seasonally adjusted. Public final demand is measured here as general government final consumption plus public gross fixed capital formation, summed over each financial year. Slate: 2025–26, and 2014–15, the last slower year.
Claim Two: Four in Every Five Dollars of Demand Was Private
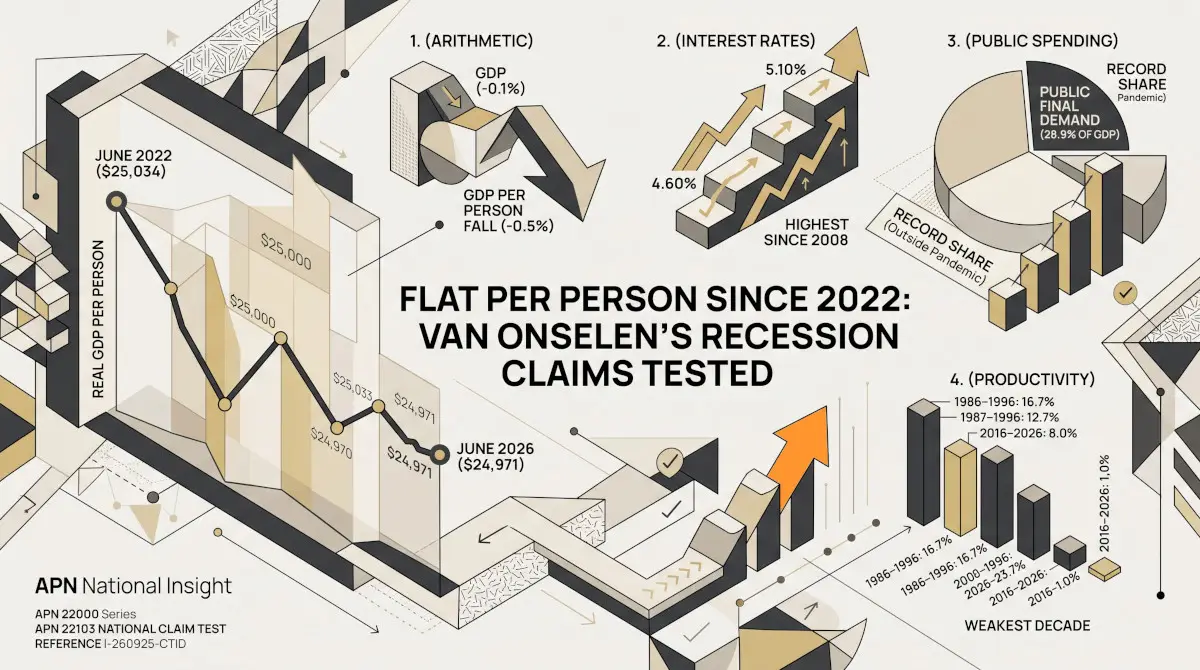
The claim holds as a statement about growth, and it is worth being clear about which. Private demand accounted for 79.8% of the growth in domestic final demand in 2025–26, close to four in five. As a share of the level of demand, public demand is larger: it made up 28.7% of domestic final demand in the June quarter of 2026, which in current prices is above any quarter before 2020 in a series that begins in 1959. Public demand is growing slowly, and it is also at a high share of the economy. APN’s Flat Per Person Since 2022 sets out the record on the public share.
The Governor has addressed the same question from the other side. She told the House Economics Committee in February 2026 that public demand adds to total demand like any other demand, describing that as a fact rather than a judgement, while declining to single it out as the cause of inflation. Her June 2026 opening statement to Senate estimates said that inflation “was too high even before the conflict in the Middle East began”. The Treasurer’s account, that inflation is partly domestic and made much worse by the oil shock, is consistent with those two statements. It differs from the Governor’s remarks of 22 September, that the labour market remains tight enough to add to inflation pressure, on the part unemployment plays. The data can show which parts of demand grew, not how the resulting inflation divides between domestic and imported sources.
Claim Three: The Lowest Average Unemployment of Any Government in 50 Years
The claim holds on the ABS monthly series, which begins in February 1978. The unemployment rate has averaged 3.97% since June 2022, against 5.13% for the next lowest period and between 5.61% and 8.68% for the others. The monthly series does not reach back the full 50 years, and the Fraser government’s average covers only its term from February 1978. The latest reading is 4.6% in August 2026.
Average Unemployment Rate by Government, February 1978 to August 2026
Source: ABS Labour Force, Australia, unemployment rate, persons, seasonally adjusted, monthly. The monthly series begins in February 1978, so the Fraser government’s average covers its term from that month. Slate: the current government.
Claim Four: The Weakest Productivity Growth of Any Decade for 50 or 60 Years
On the whole-economy measure of labour productivity, GDP per hour worked, the claim does not hold. The ten years to June 2022, the period the Treasurer refers to, saw growth of 10.4%. That was weak by historical standards, but the ten years to June 1995 were weaker, at 8.5%. The series begins in September 1978, so the earliest ten-year period it can measure ends in 1988. The ten years to June 2026, which include four years of the current government, are the weakest in the series, at 1.0%. GDP per hour worked has fallen 2.8% since June 2022, from a starting point raised by the fall in hours worked during the pandemic. The productivity slowdown is real and long-running; on this measure it has deepened since 2022 rather than ending with it.
Growth in GDP per Hour Worked over Ten Years, to the June Quarter Shown
Source: ABS Australian National Accounts (5206.0), Table 1, GDP per hour worked, index, seasonally adjusted. Cumulative growth over the ten years ending in the June quarter of each year shown. The ten years to June 1995 are the weakest ten-year period before 2022. Slate: the decade to June 2022, and the decade to June 2026.
Productivity can also be measured for the market sector alone, as output per unit of combined labour and capital input. On the ABS measure of market-sector multifactor productivity (5260.0.55.002), which begins in 1994–95, the claim does not hold either. The ten years to 2021–22 saw growth of 8.1%, the strongest ten-year period in the series. The weakest were the ten years to 2011–12, at 1.2%, and to 2013–14, at 1.1%. The ten years to 2024–25, the latest year published, grew 4.0%. The series is too short to test a comparison over 50 or 60 years.
Claim Five: Wages Growing Above 3%
The claim holds. The Wage Price Index rose 3.2% in the year to June 2026. Prices rose 3.9% over the same year, so real wages fell.
Claim Six: Net Overseas Migration Almost 50% Below the Post-COVID Peak
The claim holds. Net overseas migration peaked at 555.8 thousand in the year to September 2023 and was 292.1 thousand in the year to March 2026, 47.4% lower. The peak came 16 months after the government took office, as international students and other arrivals returned after the border reopening. Migration Trends (21250) reads +1.0390σ for the March quarter, reflecting the seasonal March-quarter peak in arrivals.
Net Overseas Migration, Year to Each Quarter, June 2022 to March 2026
Source: ABS National, State and Territory Population (3101.0), net overseas migration, thousands, summed over the four quarters to each quarter shown. Slate markers: the peak (year to September 2023) and the latest (year to March 2026).
State Split
Unemployment, public demand and net overseas migration are all published by state. A comparison of state averages across governments is outside the scope of this output, and APN holds state final demand only for Victoria; the state splits for these claims are recorded as NIL RETURN.
APN Analytical Synthesis
Of the six economic claims made on the day, five hold on the published data: public demand grew at its slowest in 11 years, private demand supplied about four in five dollars of the growth in demand, average unemployment since 2022 is the lowest in the monthly series, wages are growing above 3%, and net overseas migration is 47% below its peak. The productivity claim does not hold on GDP per hour worked or on market-sector multifactor productivity; on the first, the decade to June 2026 is the weakest in the series. Inflation (21220) reads +2.1049σ for the June quarter, the highest of its 22 full-coverage quarters. The data are consistent with an economy in which public demand has slowed but remains a high share of the total, the labour market has held, and inflation is well above its norm.
The Reserve Bank announces its decision on 29 September, and the August CPI follows on 30 September; both will test the Treasurer’s account of where the current inflation pressure comes from. This synthesis speaks only to the structural conditions the cited data can independently support; it does not constitute a view on future interest rates, inflation, fiscal policy or government performance, and no such view is expressed or implied.
Disclaimer
The analysis and information contained in this publication are for general informational and strategic purposes only and do not constitute financial, investment, legal, or any other form of professional advice. Australian Property Network is not a licensed financial advisor. Property values and market conditions can go up or down. Before making any property or investment decisions, you must conduct your own thorough research and seek independent professional advice tailored to your specific circumstances.