Low-Tax Country or Big Government? The Denniss and Sanchez Figures Tested
Too Much Market Reform, or Too Little? Denniss and Sanchez Set Out Opposing Cases (O-261006-152914-MEDIUM)
APN Asset-Wage Decoupling Index™ (24610) +1.5902σ Q2 2026 · position 94.6, ranked against 57 quarters
Growth per Person (21235) −0.1030σ Q2 2026 · position 31.4, ranked against 208 quarters
Labour Productivity (21236) −0.5493σ Q2 2026 · position 18.2, ranked against 188 quarters
Housing Policy (Affordable, Social) (21330) −1.2971σ 30 June 2025 · position 9.7, indicative position, empirical ranking begins at 20 observations (currently 14)
Scope and Purpose
Richard Denniss of The Australia Institute and the economist Alex Sanchez, writing for the Centre for Independent Studies, give opposite accounts of the past four decades of Australian economic policy. Denniss argues that tax cuts, deregulation and smaller government have failed; Sanchez that Australia is retreating from the market reforms that served it well. Their arguments are carried side by side in the companion Paired Perspectives output, Too Much Market Reform, or Too Little? Denniss and Sanchez Set Out Opposing Cases. This output takes the ten checkable propositions on which their cases rest, four from Denniss and six from Sanchez, and puts each against its primary source and against Australian Property Network’s (APN’s) certified readings. The short answer is that neither account survives intact. Australia’s tax take is below the OECD average and in the lowest third, though ten countries collect less; public spending has not been cut in aggregate; housing costs and wealth concentration have moved as Denniss says; and productivity, output per person and inflation as Sanchez says, with a smaller deficit than his figure.
Propositions One and Two: The Tax Take
Denniss says Australia is one of the lowest-tax countries in the world. Sanchez says taxes at all levels of government withdraw roughly 30% of GDP from the private economy. On the OECD’s Revenue Statistics, total tax revenue in Australia was 29.9% of GDP in 2023, the latest year with final data for every member country; in Australia’s case it covers the year to June 2024. The OECD average was 33.7% (OECD). Australia’s tax-to-GDP ratio ranked 11th lowest of the 38 member countries: ten were lower, from Mexico at 17.7% to Israel at 29.8%, and 27 were higher. Sanchez’s figure holds. Denniss’s holds against the OECD average and against most of Europe, but “one of the lowest” overstates the position: Australia sits in the lowest third, 3.8 percentage points below the average.
One difference in construction matters for the comparison with Europe. Most member countries fund pensions and health insurance partly through social security contributions, which the OECD counts as tax and which averaged a quarter of members’ tax revenue in 2023. Australia levies none, and its compulsory superannuation contributions are paid into individuals’ accounts and are not counted as tax. Part of the gap therefore reflects how retirement saving is organised, not only how much governments collect.
Total Tax Revenue as a Share of GDP, OECD Countries, 2023
Source: OECD, Revenue Statistics 2025, Table 3.1. Taxes at all levels of government, including social security contributions. Australia in slate; its 2023 reporting year runs from July 2023 to June 2024. Australia levies no social security contributions, and compulsory superannuation contributions are not counted as tax.
Propositions Three and Four: Public Spending
Denniss says governments have cut public spending on housing, health and education. Sanchez says Commonwealth payments have settled at about 26.9% of GDP, the highest outside the pandemic. In the Final Budget Outcome, payments in 2025–26 were $786.6 billion, or 26.9% of GDP (Treasury). Outside the two pandemic years, 2019–20 (27.6%) and 2020–21 (31.3%), no year since 1986–87 has been higher: that year equalled it, and 1984–85 (27.5%) and 1985–86 (27.3%) exceeded it. Sanchez’s claim holds for the past four decades. The fall he cites from the Hawke years is in the record, from 26.9% in 1986–87 to 22.9% in 1989–90; four percentage points of GDP is about $117 billion in 2025–26, as he says.
Commonwealth Receipts and Payments, Share of GDP, 1970–71 to 2025–26
Source: Treasury, Final Budget Outcome 2025–26, Appendix B, Table B.1, Australian Government general government sector, cash basis. Payments in gold, receipts in slate. Dashed line: payments in 2025–26 (26.9%).
Measured across all levels of government, public final demand, which is government consumption plus public investment, was 28.9% of GDP in the June quarter of 2026, above every quarter before the pandemic (ABS National Accounts). In aggregate, public spending has not been cut: it is at or near its highest share of the economy on record. The Final Budget Outcome is examined in APN’s earlier claim test.
Denniss’s claim is narrower: spending on the services households rely on. For housing it holds in one respect. The number of social housing dwellings rose from 426,488 in 2012 to 451,799 in 2025, but more slowly than the dwelling stock, so their share of all dwellings fell in every year, to 3.98% at 30 June 2025 (AIHW). Housing Policy (Affordable, Social) (21330) reads −1.2971σ, an indicative position of 9.7. For health, the latest year shows government spending lower: total health spending was $270.5 billion in 2023–24, 10.1% of GDP, with government spending down 0.1% and non-government spending up 3.7% in real terms (AIHW). APN holds no series of health or education spending over the decades Denniss describes, so a long-run cut in those areas is recorded as NIL RETURN. The claim does not hold for public spending as a whole; it holds for social housing as a share of the stock.
Proposition Five: Housing Has Become Increasingly Unaffordable
Denniss says housing has become increasingly unaffordable. On the APN Asset-Wage Decoupling Index™ (24610), the average Australian dwelling cost 10.16 years of full-time adult earnings in the June quarter of 2026, against 6.98 years in June 2012. The index reads +1.5902σ, position 94.6 against 57 quarters. Three quarters read higher: March 2022, December 2025 and March 2026, when it reached its record of 10.39 years. Over a longer span, the Bank for International Settlements index of Australian residential property prices rose 5.9-fold from March 1999 to March 2026, against 2.3-fold for the Wage Price Index. The claim holds. The index compares the price of a dwelling with earnings; it does not measure the cost of servicing a loan, which also moves with interest rates.
Years of Full-Time Earnings to Buy the Average Dwelling, Australia
Source: APN Asset-Wage Decoupling Index™ (24610): ABS mean price of residential dwellings divided by annual full-time adult ordinary-time earnings (ABS Average Weekly Earnings, seasonally adjusted). Quarterly, June 2012 to June 2026.
Proposition Six: Inequality Has Become Far Worse
Denniss says inequality has become far worse, and that wealth has never been so concentrated. The ABS measures inequality through its Survey of Income and Housing, and its latest results are for 2019–20; it released no results from the 2023–24 survey (ABS). On disposable household income, adjusted for household size, the Gini coefficient rose from 0.292 in 1996–97 to 0.336 in 2007–08, and was 0.324 in 2019–20. On household net worth it rose from 0.573 in 2003–04 to 0.621 in 2017–18, and was 0.611 in 2019–20, when the wealthiest fifth of households held 63% of household wealth and the least wealthy fifth less than 1%. The claim holds for wealth between 2003–04 and 2019–20 and for income since the mid-1990s. Income inequality has not risen since 2007–08 on this measure, so “far worse” overstates the recent record. The claim that wealth has never been so concentrated refers to the world and to a longer history than the ABS series, and is recorded as NIL RETURN; in Australia’s own series the highest wealth reading was 2017–18, not the latest survey.
Inequality of Income and Wealth, Australia, Gini Coefficient
| Survey year | Disposable household income | Household net worth |
|---|---|---|
| 1994–95 | 0.302 | – |
| 1995–96 | 0.296 | – |
| 1996–97 | 0.292 | – |
| 1997–98 | 0.303 | – |
| 1999–00 | 0.310 | – |
| 2000–01 | 0.311 | – |
| 2002–03 | 0.309 | – |
| 2003–04 | 0.306 | 0.573 |
| 2005–06 | 0.314 | 0.593 |
| 2007–08 | 0.336 | – |
| 2009–10 | 0.329 | 0.602 |
| 2011–12 | 0.320 | 0.593 |
| 2013–14 | 0.333 | 0.605 |
| 2015–16 | 0.323 | 0.605 |
| 2017–18 | 0.328 | 0.621 |
| 2019–20 | 0.324 | 0.611 |
Source: ABS, Household Income and Wealth, Australia, 2019–20. Income is equivalised disposable household income. 0 is complete equality and 1 complete inequality. Wealth was first collected in its current form in 2003–04 and was not collected in 2007–08. The ABS has released no later results.
Proposition Seven: Personal Income Tax Will Soon Exceed Half of Commonwealth Tax
Sanchez says personal income tax will soon exceed 50% of all Commonwealth tax revenue, a share not seen since the GST was introduced. In 2025–26, individuals and other withholding taxes raised $366.5 billion of the Commonwealth’s $704.2 billion in tax receipts, or 52.0% (Treasury). On this cash measure the threshold has already been passed. The paper was published before the outcome for the year was known. The comparison with the years before the GST needs a historical series APN does not hold, and is recorded as NIL RETURN. The OECD figures show the same feature from another angle: across all levels of government, personal income tax was 42.6% of Australia’s tax revenue in 2023, against an OECD average of 23.7%.
Proposition Eight: About $1 Trillion of Debt, and a Deficit of 1.3% of GDP
Sanchez says the Commonwealth carries around one trillion dollars in gross debt and an underlying cash deficit of 1.3% of GDP. Gross debt was $971.4 billion at 30 June 2026, or 33.2% of GDP (Treasury). The level holds; as a share of GDP, gross debt has fallen in each of the past four years. The underlying cash deficit for 2025–26 was $22.3 billion, or 0.8% of GDP, against 1.0% estimated in the 2026–27 Budget in May. The deficit holds in direction, but 1.3% matches neither the outcome nor the Budget estimate for the year. Whether the deficit is structural rather than cyclical is a judgement APN does not test.
Proposition Nine: Output per Person Has Gone Backwards, and Productivity Has Stagnated
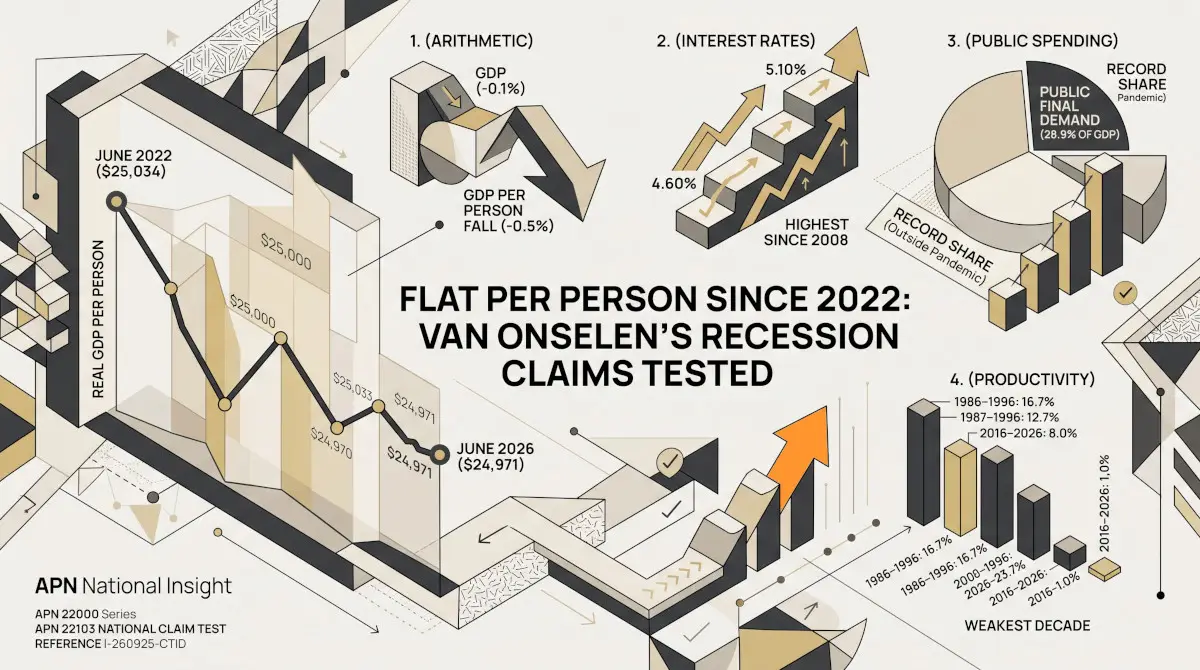
Sanchez says real GDP per person has gone backwards and productivity has stagnated. Real GDP per person was $24,971 in the June quarter of 2026 against $25,034 four years earlier, 0.25% lower; it fell through 2023 and 2024 and has risen since, by 0.68% over the year to June 2026 (ABS). Growth per Person (21235) reads −0.1030σ, position 31.4 against 208 quarters. The per person claim holds over four years, not over the latest year.
GDP per hour worked rose 1.0% in the ten years to June 2026, against rises of between 15.4% and 21.4% in each of the three decades before, and fell 0.20% over the latest year. Labour Productivity (21236) reads −0.5493σ, position 18.2 against 188 quarters. The productivity claim holds.
Proposition Ten: Inflation Above the Target Band
Sanchez says inflation has stayed above the Reserve Bank’s 2–3% target band for several consecutive quarters. Annual Consumer Price Index inflation was 3.2% in the September quarter of 2025, 3.6% in December, 4.1% in March 2026 and 3.9% in June (ABS). The claim holds: four consecutive quarters above the band to June 2026, three when the paper was published. Inflation (21220) reads +2.1049σ for the June quarter, the highest of its 22 full-coverage quarters.
Secure Work
Denniss says secure work is much harder to find. APN holds no measure of job security, such as the share of casual or fixed-term employment, and the claim is recorded as NIL RETURN. The availability of work points the other way: Labour Market Tightness (21231) reads +0.5983σ for the June quarter, position 83.6 against 123 quarters, with unemployment at 4.4%.
Not Tested
Denniss’s comparisons of the cost of living, life expectancy and wellbeing with European countries, and his claims about the tax paid by billionaires, the gas industry and supermarkets, rest on sources APN does not hold, and are recorded as NIL RETURN. Sanchez’s estimate that the average worker pays about $31,000 a year in tax, his comparison of Australia’s top marginal tax rate with other countries, his counts of disability scheme participants and pension recipients, and his costs of industry assistance are likewise recorded as NIL RETURN. Both speakers’ recommendations are proposals, and APN does not test proposals.
APN Analytical Synthesis
The data do not settle the argument between the two speakers, but they narrow it. Australia taxes less than the OECD average and sits in the lowest third, though ten countries collect less, and part of the gap reflects how it funds retirement. Public spending has not been cut in aggregate: Commonwealth payments are at their highest share of GDP outside the pandemic since the mid-1980s, while social housing has fallen as a share of the stock in every year since 2012. A dwelling costs 10.16 years of earnings, close to the record, and wealth was more unequally held in 2019–20, the latest survey, than in 2003–04, while income inequality has been broadly stable since 2007–08. Productivity growth over the past decade is the weakest in the record, output per person is slightly below its 2022 level, and inflation has been above the target band for four quarters. APN Asset-Wage Decoupling Index™ (24610) reads +1.5902σ, Labour Productivity (21236) −0.5493σ and Housing Policy (Affordable, Social) (21330) −1.2971σ. Each account is best supported where it describes its own ground, Denniss on outcomes for households and Sanchez on the public accounts and productivity, and weakest where it describes the other’s: Denniss on the size of government, Sanchez on the size of the deficit.
The next data will test the argument: the ABS’s next Survey of Income and Housing results, for 2025–26, the first since 2019–20; the September quarter national accounts in December; and the OECD’s next Revenue Statistics. This synthesis speaks only to the structural conditions the cited data can independently support; it does not constitute a view on future property values, taxation or government policy, and no such view is expressed or implied.
Disclaimer
The analysis and information contained in this publication are for general informational and strategic purposes only and do not constitute financial, investment, legal, or any other form of professional advice. Australian Property Network is not a licensed financial advisor. Property values and market conditions can go up or down. Before making any property or investment decisions, you must conduct your own thorough research and seek independent professional advice tailored to your specific circumstances.