
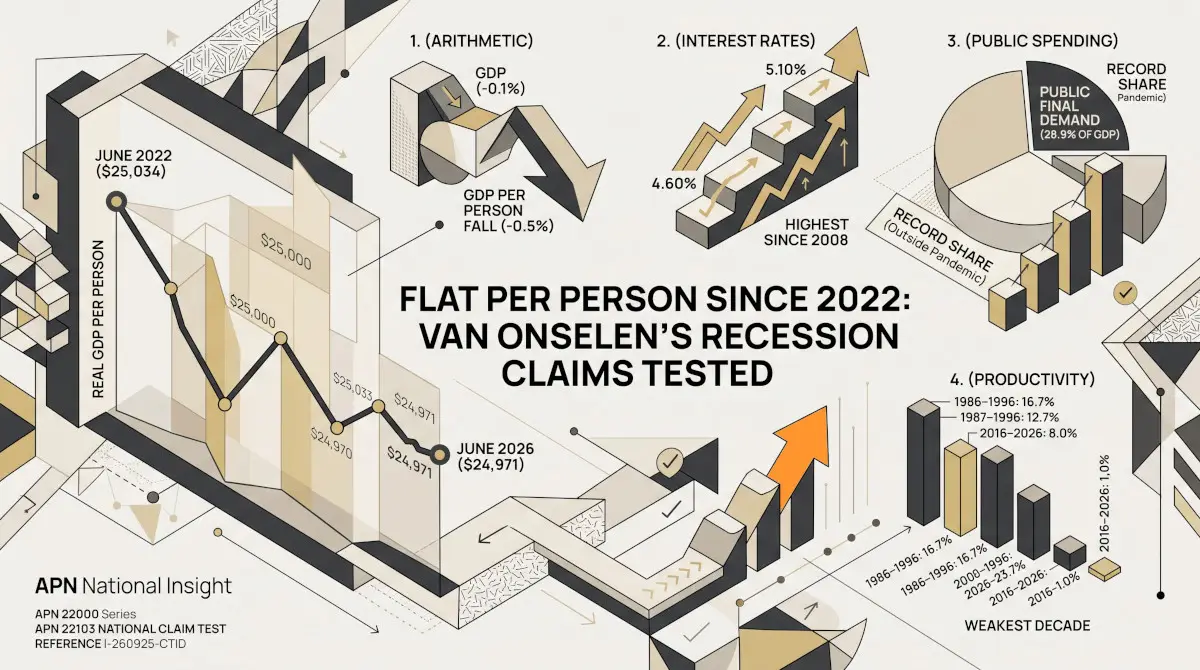

Flat Per Person Since 2022: Van Onselen’s Recession Claims Tested
Van Onselen: A 2027 Recession Risk, and Why Spending Restraint Cuts Both Ways (O-260925-OPID-MEDIUM)
Employment & GDP (21230) +0.5947σ Q2 2026
Interest Rates (21210) +0.9807σ Q2 2026 · position 96.6, ranked against 30 quarters
Inflation (21220) +2.1049σ Q2 2026 · position 100.0, ranked against 22 quarters
Scope and Purpose
In a September 2026 radio interview, Leith van Onselen, chief economist at MacroBusiness, set out the risk of a technical recession in Australia in 2027. His argument is carried in the companion Economists & Analysts output, Van Onselen: A 2027 Recession Risk, and Why Spending Restraint Cuts Both Ways. It rests on five checkable propositions: that GDP per person is about 0.3% below its mid-2022 level; that a small fall in GDP would mean a large fall per person; that markets expect the cash rate to reach 5.1%, the highest since 2008; that governments are spending a record share of GDP; and that productivity growth over the past decade has been weak. This output puts each against the ABS and Reserve Bank series it rests on and against Australian Property Network’s (APN’s) certified readings. The short answer is that the per capita, public spending and productivity claims hold on Australia’s own record, the rate arithmetic holds, and the international comparisons cannot be tested here.
Proposition One: GDP per Person Is About 0.3% Below Mid-2022
Real GDP per person stood at $25,034 in the June quarter of 2022 and at $24,971 in the June quarter of 2026, a difference of 0.25%. The claim holds: output per person is marginally lower than four years ago, while the economy as a whole has grown.
Real GDP per Person, June Quarter 2022 to June Quarter 2026
Source: ABS Australian National Accounts (5206.0), Table 1, GDP per capita, chain volume measures, seasonally adjusted, dollars per person. Dashed line: the June quarter 2022 level.
The path explains the claim about recession. GDP per person fell in 10 of the 16 quarters since mid-2022, including seven consecutive quarters from March 2023 to September 2024, when it reached its low point, 1.4% below the June 2022 level. It has since recovered by 1.1%, rising in four of the past six quarters, and the ABS puts growth over the year to June 2026 at 0.7% (ABS National Accounts). The description of four years at or near per capita recession fits 2023 and 2024; over the past year output per person has been broadly flat to rising. APN’s analysis Growth Per Person sets out how much of Australia’s GDP growth has come from a larger population.
The comparison with the rest of the English-speaking world and the euro zone depends on other countries’ national accounts, which APN does not hold. It is the speaker’s claim and is recorded as NIL RETURN.
Proposition Two: A Small Technical Recession Would Be a Large Per Capita One
The arithmetic holds. The resident population grew by 0.47% in the March quarter of 2026, the latest ABS estimate, and by between 0.27% and 0.50% in each of the five quarters to then. If GDP fell by 0.1% in a quarter while the population grew by about 0.4%, GDP per person would fall by about 0.5%. For comparison, the largest single-quarter fall in the 2023–24 sequence was 0.48%. A technical recession of that size would therefore bring a fall in output per person at least as fast as the largest of the past four years.
Proposition Three: Two or Three More Rises, to 5.1%
On 29 September 2026 the Reserve Bank raised the cash rate target by 25 basis points to 4.60%, effective the following day (Reserve Bank). That is the first of the rises the speaker anticipated, and it puts the target at its highest since the Reserve Bank’s cut of November 2011. Two further rises of 25 basis points would take it to 5.10%, and the target was last above that level in November 2008, when it stood at 5.25% before the Reserve Bank’s cut in December of that year. The claim that 5.1% would be the highest since 2008 holds. The market pricing is less settled. The speaker’s written commentary of 18 September described two further rises as fully priced, with a strong chance of a third (MacroBusiness). ABC News, citing futures pricing on 22 September, reported about a 90% chance of a rise at the 29 September meeting and roughly even odds of a second in November (ABC News). The first of those was delivered. Whether a second and a third follow is the speaker’s reading of the forward markets, and is recorded as NIL RETURN. Interest Rates (21210) reads +0.9807σ for the June quarter, position 96.6, ranked against 30 full-coverage quarters; only the March quarter was higher. The June quarter reading predates the September rise.
Proposition Four: Governments Are Spending a Record Share of GDP
Public final demand, which is government consumption plus public investment at all levels of government, was 28.9% of GDP in the June quarter of 2026. Before 2020, the highest quarter in a series that begins in 1959 was 28.3%, in the September quarter of 1986. Every quarter since September 2024 has been above that level. Two quarters have been higher: June 2020, at 29.1%, when pandemic support was at its peak and private activity had contracted, and, fractionally, September 2025 (28.93% against 28.91%); at one decimal place the two recent quarters are equal. The claim holds in substance: outside the pandemic quarter, public spending is level with the highest share of GDP on record. Measured on consumption alone, spending by the national government reached 11.2% of GDP in the June quarter, its highest in the series, while state and local government consumption, at 12.2%, is below its 2020 peak.
Public Final Demand as a Share of GDP, June Quarter 2016 to June Quarter 2026
Source: ABS Australian National Accounts (5206.0), Table 3, current prices, seasonally adjusted. Public final demand is general government final consumption expenditure plus public gross fixed capital formation (general government and public corporations), all levels of government. Dashed line: the highest quarter before 2020, 28.3% in the September quarter of 1986, in a series that begins in 1959.
The share has been close to flat since late 2024, between 28.7% and 28.9%. That matters for the argument about excess demand. A high and steady share keeps demand elevated, but it adds little to growth from quarter to quarter. In the June quarter, public demand added 0.1 percentage points to GDP growth, with government consumption adding to it and public investment subtracting (ABS National Accounts). The level of public spending is at or near its peak, while its contribution to growth in the latest quarter was small. Restraint of the kind the speaker proposes would lower that level, and in the quarters in which it did, public demand would subtract from growth.
The composition differs between states, which matters for a prescription that covers every level of government. In Victoria, spending by state and local government, including investment by state public corporations, was 17.0% of state final demand in the June quarter of 2026, up from 15.4% in June 2019. Across Australia, the same measure was 16.3% of domestic final demand, up from 15.3%. Victoria’s total public share, 27.9%, is below the national 28.7% of domestic final demand, because federal spending forms a smaller part of demand there. The national record is carried mainly by federal spending; state and local spending is higher in Victoria than nationally, and has risen faster since 2019.
Proposition Five: A Decade of Weak Productivity Growth
GDP per hour worked rose 1.0% in the ten years to the June quarter of 2026. In each of the three preceding decades it rose by between 15.4% and 21.4%. On Australia’s own record, no ten-year period since the ABS series began in 1978 shows weaker growth in labour productivity than the one just ended. The claim that it is among the weakest in the advanced world depends on international comparisons and is recorded as NIL RETURN.
Growth in GDP per Hour Worked, by Decade to the June Quarter
Source: ABS Australian National Accounts (5206.0), Table 1, GDP per hour worked, index, seasonally adjusted. Cumulative growth over each ten-year period, June quarter to June quarter. The latest decade is shown in slate.
Not Tested
The diesel price of about $3 a litre is the speaker’s local observation, and Australia’s dependence on diesel relative to other economies is his claim; neither is tested here, and both are recorded as NIL RETURN. The forecast of a technical recession in 2027 is a forecast, and APN does not test forecasts.
The monthly Consumer Price Index for August 2026, released on 30 September, bears on the direction of his fuel argument, though not on the diesel price he cites. Automotive fuel, which covers petrol, diesel and other fuels together, rose 14.8% in the month and 13.5% over the year. Headline inflation rose to 4.0% over the year, from 3.5% in July, while the trimmed mean held at 3.6% (ABS Consumer Price Index). In its statement of 29 September, the Reserve Bank said higher fuel prices had partly passed through to the prices of other goods and services (Reserve Bank). That is the second-round effect the speaker describes, reported by the central bank rather than measured here.
APN Analytical Synthesis
Of the speaker’s five checkable propositions, four hold on Australia’s own record and one holds in its arithmetic, with market pricing APN cannot confirm. Public final demand is 28.9% of GDP, above every quarter before the pandemic. GDP per person is 0.25% below mid-2022 after a seven-quarter decline to September 2024 and a partial recovery since. Labour productivity rose 1.0% in the decade to June 2026, the weakest decade in the ABS record. Employment & GDP (21230) reads +0.5947σ for the June quarter, above its norm, while Inflation (21220) reads +2.1049σ, the highest of its 22 full-coverage quarters. The data show an economy growing in total, flat per person and with prices running well above their norm, which is the combination in which the speaker’s tension between spending restraint and support for activity is sharpest.
The next data will test the argument. The Reserve Bank raised the cash rate target to 4.60% on 29 September, the first of the rises the speaker expects, and the September quarter national accounts, due in early December, will show whether output per person has resumed its decline. This synthesis speaks only to the structural conditions the cited data can independently support; it does not constitute a view on future interest rates, economic growth or government policy, and no such view is expressed or implied.
Disclaimer
The analysis and information contained in this publication are for general informational and strategic purposes only and do not constitute financial, investment, legal, or any other form of professional advice. Australian Property Network is not a licensed financial advisor. Property values and market conditions can go up or down. Before making any property or investment decisions, you must conduct your own thorough research and seek independent professional advice tailored to your specific circumstances.

