When Builders Fail: What Australia’s Construction Insolvency Record Can and Cannot Show
Business Insolvency (21280) +0.9921σ Q2 2026 · 78.9, ranked against 20 quarters
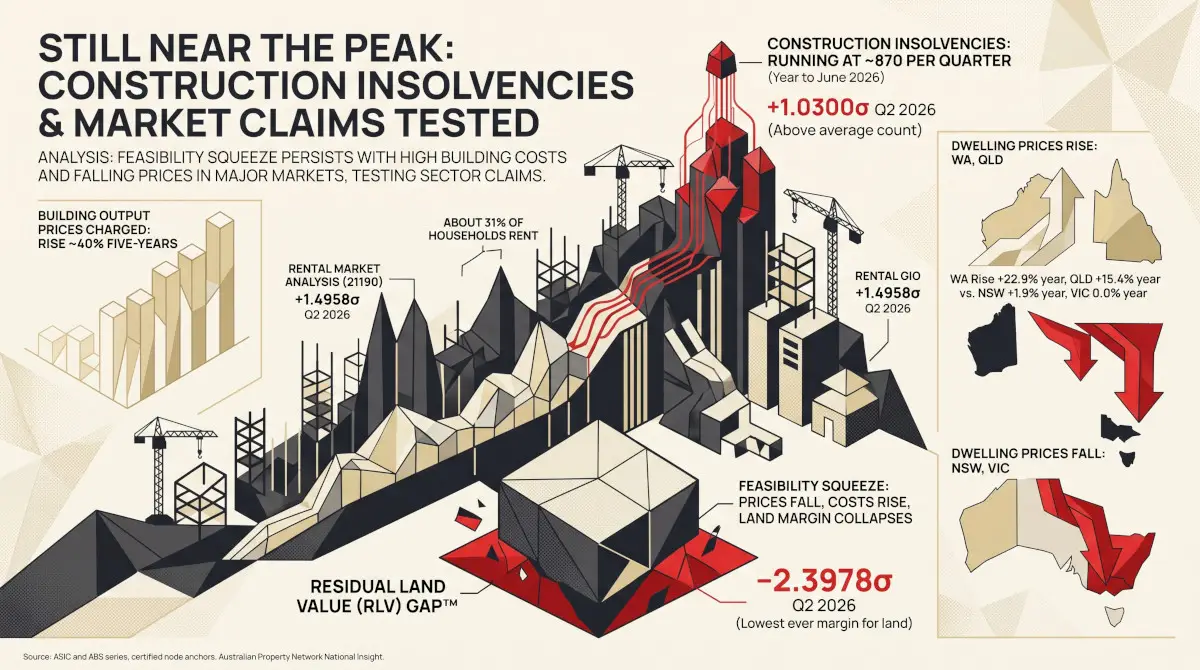
Construction Insolvency (21281) +1.0300σ Q2 2026 · 84.2, ranked against 20 quarters
Insolvency Outside Construction (21282) +0.9543σ Q2 2026 · 73.7, ranked against 20 quarters
Scope and Purpose
In an interview published in September 2026, the economist Arthur Laffer argued that a profit-and-loss system needs its losses: firms that can fail price risk carefully, and when they do fail, their assets pass to new owners rather than disappearing. His argument, carried in the companion Industry Voices output Laffer on Losses (O-260923-150668-LOW), concerned the United States banking system in 2008. This output applies it to the part of Australia’s economy where firm failure bears most directly on housing: residential and commercial construction. It asks what Australian Property Network’s (APN’s) certified insolvency readings and the ASIC series behind them say about how often builders are failing, and whether the record can test Laffer’s claim that failure is cheap because the assets survive. The record answers the first question clearly and cannot answer the second.
How Often Builders Are Failing
ASIC counts the companies that enter external administration, or have a controller appointed, for the first time each quarter. In the June quarter 2026 the count for construction was 902. In the year to June 2026 it was 3,472, down 3.4% on the 3,596 of the year before, and 2.7 times the 1,284 recorded in the year to June 2022. Through quarter-to-quarter swings, the quarterly count rose from 237 in the September quarter 2021 to 898 in the September quarter 2024, and has moved between 778 and 938 in every quarter since. Construction failures rose for three years and have since held at that higher level rather than continuing to rise.
Construction Companies Entering External Administration, Sep 2021 – Jun 2026
Source: ASIC Insolvency Statistics, Series 1, companies entering external administration or having a controller appointed for the first time, Construction industry, quarterly, September quarter 2021 to June quarter 2026. Earlier quarters are not comparable because of a change in industry coding in 2021.
The certified readings place that level against its own history. Construction Insolvency (21281) reads +1.0300σ for the June quarter 2026, ranked 84.2 against the 20 comparable quarters since September 2021: 16 of the other 19 quarters recorded fewer failures. Insolvency Outside Construction (21282) reads +0.9543σ, ranked 73.7, and the Business Insolvency (21280) composite of the two reads +0.9921σ, ranked 78.9. Construction’s share of all companies entering administration for the first time has held between 24.1% and 25.5% in each of the last eight quarters, against a range of 21.7% to 31.5% before that. Construction is failing at an elevated rate, but at the same elevated rate as the rest of the economy, not ahead of it. That matters for Laffer’s argument: the builder failures are not an isolated sector event but part of a broad rise in company failures since 2021.
Where the Losses Fall
Laffer’s claim that failure is cheap rests on two conditions: that the assets survive, and that the losses fall on the owners and lenders who took the risk. In construction the first condition largely holds. A partly built house or apartment block does not disappear when its builder enters administration; a replacement builder is engaged to finish it, often at a higher price. The second condition does not hold in the same way. A builder’s creditors include households with a home under contract and subcontractors owed for work already done, and neither group priced the builder’s risk the way a bank lending to it does. In residential construction, a share of the loss from a builder’s failure falls on parties who did not choose to bear it. Most states operate a statutory home warranty or domestic building insurance scheme for that reason, which is itself an arrangement of the kind Laffer’s principle would limit.
How large that third-party share is cannot be established from APN’s data. The ASIC series counts companies, not dwellings, contracts or creditors, and records neither how many homes a failed builder left unfinished nor what it cost to complete them. APN holds no certified series on completion delays or cost overruns after a builder’s failure, or on home warranty claims. NIL RETURN is declared for the distribution of losses from construction insolvency, at national and state level. The certified readings can therefore describe how often the discipline Laffer describes is being applied, but not who is paying for it.
APN Analytical Synthesis
The weight of node evidence supports the interpretation that Australian construction is in a period of sustained, elevated firm failure rather than an accelerating one. Construction Insolvency (21281) at +1.0300σ and the count of 902 companies in the June quarter describe a level reached in late 2024 and held since, and construction’s steady quarter share of all failures, together with Business Insolvency (21280) at +0.9921σ, places it inside an economy-wide rise rather than apart from it. By Laffer’s test, failure is being allowed to happen in Australian construction, at a rate well above that of 2021 and 2022.
What the record cannot separate is whether that failure is doing the work Laffer attributes to it. A plateau is consistent with weaker firms having already left the sector and those remaining pricing risk more carefully, which is his account; it is equally consistent with cost and margin pressure still holding at a level that sustains failures at a steady rate. The count also cannot show how much of the loss has fallen on households and subcontractors rather than on owners and lenders, and that distribution, not the number of failures, is what decides whether failure in construction is as cheap as Laffer argues. The quarterly counts are subject to revision as late appointments are recorded. This synthesis speaks only to the structural conditions the cited data can independently support; it does not constitute a view on future insolvency rates, on the solvency of any firm, or on policy, and no such view is expressed or implied. The next test is ASIC’s September quarter 2026 release: a quarter outside the 778 to 938 range of the last seven would end the plateau in one direction or the other.
Disclaimer
The analysis and information contained in this publication are for general informational and strategic purposes only and do not constitute financial, investment, legal, or any other form of professional advice. Australian Property Network is not a licensed financial advisor. Property values and market conditions can go up or down. Before making any property or investment decisions, you must conduct your own thorough research and seek independent professional advice tailored to your specific circumstances.