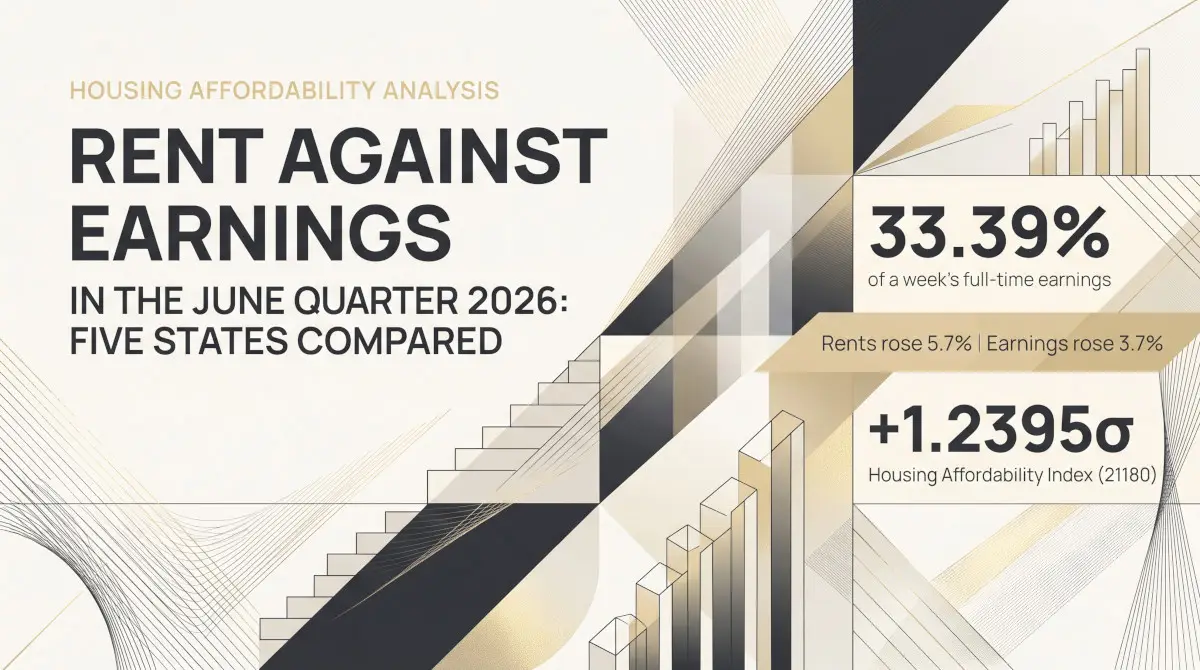

A new lease in the June quarter 2026 cost 33.39% of a week’s full-time adult ordinary-time earnings across the five states whose bond data APN holds, up from 32.74% a year earlier. Rents on new leases rose 5.7% over the year; full-time earnings rose 3.7%. Rents outpaced earnings in all five states. Over two years the share rose most in Western Australia and Tasmania, by 2.5 and 2.3 percentage points, and least in New South Wales, by 0.2 points, although New South Wales still has the highest share. Housing Affordability Analysis (21180), which reads the five-state share against its own short history, stands at +1.2395σ.
Rents cover new leases in New South Wales, Queensland, South Australia, Western Australia and Tasmania; earnings are the ABS full-time adult ordinary-time measure.
What the measure is
The measure divides a week’s rent on a new lease by a week’s earnings. The rent is APN’s new-lease rent measure: the median rent on newly lodged bonds in each council area, averaged with each area weighted by its number of bonds. It covers New South Wales, Queensland, South Australia, Western Australia and Tasmania, and it is set out in New-Lease Rents in the June Quarter 2026: Five States Compared. The earnings are the Australian Bureau of Statistics’ average weekly ordinary-time earnings of full-time adults, seasonally adjusted, from the Average Weekly Earnings release for May 2026. The ABS publishes earnings for May and November only, so each quarter uses the latest figure available: May for the June and September quarters, November for December and March.
The earnings figure is what one full-time adult earns in ordinary hours, before tax and excluding overtime. It is not household income. A household with two earners, or one part-time earner, faces a different share. The measure tracks how fast rents and full-time pay move against each other, not what any particular household spends on rent.
The five-state share since 2023
New-lease rent as a share of full-time adult ordinary-time earnings, five states, September quarter 2023 to June quarter 2026
APN calculation based on Australian Bureau of Statistics data: Average Weekly Earnings, Australia, May 2026, Table 2 (A84998729F). Five-state new-lease rent measure as a share of full-time adult ordinary-time earnings. Rents from bond lodgement data of NSW Fair Trading, the Residential Tenancies Authority (Queensland), Consumer and Business Services (South Australia), Consumer Protection (Western Australia) and Consumer, Building and Occupational Services (Tasmania).
The share rose from 31.86% in the September quarter 2023 to 33.39% in the June quarter 2026. It peaked at 33.58% in the March quarter 2026, then eased when the May 2026 earnings figure replaced November’s. Because earnings are updated only twice a year, the share moves in steps: it eased in each of the last four quarters in which a new earnings figure arrived, and rose with rents in every quarter in between. Like quarters a year apart give the clearer comparison: 32.63% in June 2024, 32.74% in June 2025 and 33.39% in June 2026.
State by state
New-lease rent as a share of full-time adult ordinary-time earnings, by state, June quarter 2026
APN calculation based on Australian Bureau of Statistics data: Average Weekly Earnings, Australia, May 2026, Table 12 (A84994877K, A84999980X, A84975593C, A85002055A, A84998738J). New-lease rent measure in each state as a share of that state’s full-time adult ordinary-time earnings. Rents from bond lodgement data of NSW Fair Trading, the Residential Tenancies Authority (Queensland), Consumer and Business Services (South Australia), Consumer Protection (Western Australia) and Consumer, Building and Occupational Services (Tasmania).
| State | Rent, June quarter 2026 | Earnings, May 2026 | Share, June quarter 2024 | Share, June quarter 2025 | Share, June quarter 2026 | Change over two years (points) |
|---|---|---|---|---|---|---|
| New South Wales | $754.79 | $2,108.80 | 35.58% | 34.80% | 35.79% | +0.21 |
| Western Australia | $714.94 | $2,227.40 | 29.56% | 30.91% | 32.10% | +2.54 |
| Queensland | $655.08 | $2,042.20 | 30.63% | 31.66% | 32.08% | +1.45 |
| Tasmania | $532.94 | $1,846.30 | 26.57% | 26.62% | 28.87% | +2.29 |
| South Australia | $565.48 | $1,970.20 | 28.13% | 28.19% | 28.70% | +0.57 |
| Five states | $695.83 | $2,083.70 | 32.63% | 32.74% | 33.39% | +0.77 |
APN calculation based on Australian Bureau of Statistics data: Average Weekly Earnings, Australia, May 2026, Tables 2 and 12. Earnings for the Five states row are the national figure (Table 2, A84998729F). Rents from bond lodgement data of NSW Fair Trading, the Residential Tenancies Authority (Queensland), Consumer and Business Services (South Australia), Consumer Protection (Western Australia) and Consumer, Building and Occupational Services (Tasmania).
New South Wales has the highest share, 35.79%, and it is little changed over two years, from 35.58% in June 2024: it fell to 34.80% in the year to June 2025, then rose 1.0 point in the latest year. Western Australia’s share rose from 29.56% to 32.10% over the same two years, even though its full-time earnings, $2,227.40 a week in May 2026, are the highest of the five states. It is now level with Queensland’s 32.08%. Tasmania’s share rose 2.24 points in the latest year alone, the largest one-year rise of the five, and at 28.87% it is now above South Australia’s 28.70%, which is the lowest.
Rents against earnings
New-lease rents and full-time adult ordinary-time earnings, five states, September quarter 2023 = 100
APN calculation based on Australian Bureau of Statistics data: Average Weekly Earnings, Australia, May 2026, Table 2 (A84998729F). September quarter 2023 = 100. Earnings are published for May and November; each quarter carries the latest figure. Rents from bond lodgement data of NSW Fair Trading, the Residential Tenancies Authority (Queensland), Consumer and Business Services (South Australia), Consumer Protection (Western Australia) and Consumer, Building and Occupational Services (Tasmania).
| State | Rent growth, year to June quarter 2026 | Earnings growth, year to May 2026 | Difference (points) |
|---|---|---|---|
| Tasmania | 11.6% | 3.0% | +8.68 |
| Western Australia | 7.3% | 3.4% | +3.97 |
| New South Wales | 5.7% | 2.8% | +2.94 |
| South Australia | 5.9% | 4.0% | +1.87 |
| Queensland | 5.8% | 4.4% | +1.39 |
| Five states | 5.7% | 3.7% | +2.08 |
APN calculation based on Australian Bureau of Statistics data: Average Weekly Earnings, Australia, May 2026, Tables 2 and 12. Change in the new-lease rent measure over the year to the June quarter 2026, against the change in full-time adult ordinary-time earnings over the year to May 2026. Rents from bond lodgement data of NSW Fair Trading, the Residential Tenancies Authority (Queensland), Consumer and Business Services (South Australia), Consumer Protection (Western Australia) and Consumer, Building and Occupational Services (Tasmania).
Since the September quarter 2023 the five-state rent measure has risen 18.8%; the earnings figure used against it has risen 13.4%. Over the latest year, rents rose faster than earnings in every state. The gap was widest in Tasmania, where rents rose 11.6% and earnings 3.0%. In Queensland and South Australia, where earnings rose fastest (4.4% and 4.0%), the gap was narrowest. In New South Wales earnings rose least, 2.8%, while rents rose at about the same pace as in Queensland and South Australia, so its share rose more over the year than theirs did.
The reading
Housing Affordability Analysis (21180) standardises the five-state share against its own history since September 2023. At 33.39% it sits 1.2395 standard deviations above the average of 32.73% for that period. Because the history is only 12 quarters long, the position of 89.2 is an indicative position, derived from the standard score; the empirical ranking begins at 20 quarters (currently 12). The average moves with each new quarter. While the share keeps rising, a reading against so short a history will stay high. It shows the direction of the share more than how unusual it is. The rent measure on its own is read by Rental Market Analysis (21190).
What this does not show
The rent is for new leases only, so it moves ahead of the rents most tenants pay, and it depends on where leases are signed in each quarter. The measure excludes Victoria, the ACT and the Northern Territory. The earnings figure is one full-time adult’s ordinary-time pay, not the income of the household paying the rent, and state earnings estimates come from a sample survey, so those for the smaller states carry wider margins of error. Rents are not seasonally adjusted and earnings are, so only like quarters should be compared. The measure says nothing about purchase prices or loan repayments. How repayments compared with income across suburbs at the 2021 Census is set out in Mortgage Repayments Against Income, Suburb by Suburb, 2021.
- Australian Bureau of Statistics (Reference period: May 2026) Average Weekly Earnings, Australia [https://www.abs.gov.au/statistics/labour/earnings-and-working-conditions/average-weekly-earnings-australia/may-2026], ABS Website, accessed 1 October 2026.
- Consumer and Business Services (South Australia) Private rent report [https://data.sa.gov.au/data/dataset/private-rent-report], accessed 30 September 2026.
- Consumer Protection (Western Australia) Rental bonds data, 2023 to current [https://housing-data-exchange.ahdap.org/dataset/west-australia-rental-bonds-data-2023-current], accessed 30 September 2026.
- Consumer, Building and Occupational Services (Tasmania) Rental bond statistics [https://www.cbos.tas.gov.au/topics/housing/renting/bonds/rental-bond-statistics], accessed 30 September 2026.
- NSW Fair Trading Rental bond data: lodgements [https://www.nsw.gov.au/housing-and-construction/rental-forms-surveys-and-data/rental-bond-data], accessed 30 September 2026.
- Residential Tenancies Authority (Queensland) Median rents quarterly data [https://www.rta.qld.gov.au/forms-resources/rta-quarterly-data/median-rents-quarterly-data], accessed 30 September 2026.
ABS material is used under a Creative Commons Attribution 4.0 International licence. Calculations, standardisations and index readings are APN’s and are not attributable to the ABS.
Rent figures are calculated by APN from the state bond data named above and are not attributable to any publisher.
Findings are presented on the basis of data and evidence alone.