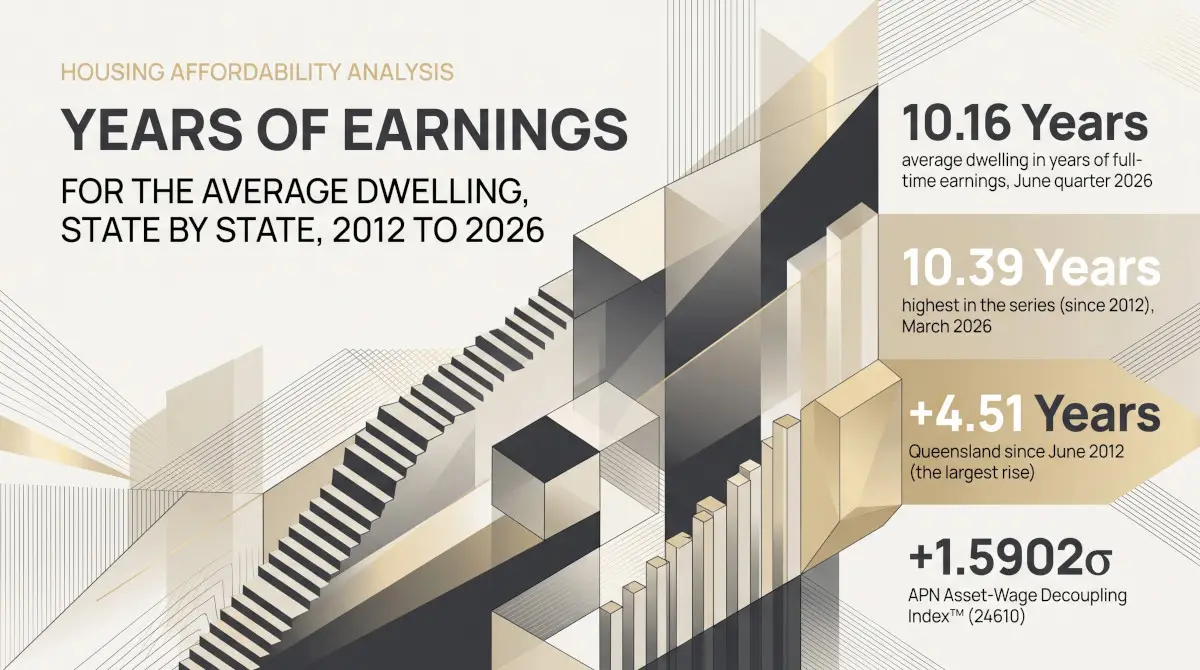

The average Australian dwelling was worth 10.16 years of full-time earnings in the June quarter 2026, up from 6.98 years in June 2012. Since 2012 the mean dwelling price has risen 125% and full-time earnings 54%. The states have not moved together. New South Wales, Victoria, Tasmania and the ACT reached their highest ratios in 2021 or 2022 and are now more than a year of earnings below them. Queensland, South Australia and Western Australia reached theirs in 2026, and Queensland has risen further than any other state, from 6.14 to 10.65 years. The Northern Territory is the only jurisdiction where the ratio is lower than in 2012.
Years of earnings: the mean price of residential dwellings divided by a year of full-time adult ordinary-time earnings.
What the measure is
The measure divides the average price of a dwelling by a year of earnings. The price is the mean price of residential dwellings from the ABS Total Value of Dwellings: the estimated value of the whole stock of homes, houses and apartments together, divided by the number of dwellings. The earnings are the ABS average weekly ordinary-time earnings of full-time adults, seasonally adjusted, from Average Weekly Earnings, multiplied by 52. The ABS publishes earnings for May and November only, so each quarter uses the latest figure: May for the June and September quarters, November for December and March. Each state’s price is divided by that state’s own earnings.
The result reads as the number of years a full-time adult’s gross ordinary-time pay would take to equal the value of the average dwelling. It is a ratio of two averages, not the price of any particular home or the income of any particular buyer. Many households have more than one income, and none spend all of it on housing, so the figure is best read as a comparison over time and between states.
Australia since 2012
Mean dwelling price in years of full-time adult earnings, Australia, June quarter 2012 to June quarter 2026
APN calculation based on Australian Bureau of Statistics data: Total Value of Dwellings, Australia, June quarter 2026, Table 1 (A83728647F). Mean price of residential dwellings divided by annual full-time adult ordinary-time earnings (weekly, seasonally adjusted, × 52). Earnings: Average Weekly Earnings, Australia, May 2026, Table 2 (A84998729F). Each quarter uses the latest earnings figure: May for June and September, November for December and March.
Nationally the ratio held between 6.84 and 6.98 years from June 2012 to September 2013, rose to 8.46 years by June 2017, eased to 7.64 years in June 2019, then climbed to 10.24 years in March 2022. After easing through 2022 to 9.48 years in March 2023, it rose again to 10.39 years in the March quarter 2026, the highest since the series began in 2012. It fell to 10.16 years in the June quarter, as the May 2026 earnings figure replaced November’s and the mean price eased 0.7%.
Where the ratio peaked in 2021–22
Mean dwelling price in years of full-time adult earnings: New South Wales, Victoria, the ACT and Tasmania
APN calculation based on Australian Bureau of Statistics data: Total Value of Dwellings, Australia, June quarter 2026, Table 1 (A83728647F and state series A83728607L to A83728642V). Mean price of residential dwellings divided by annual full-time adult ordinary-time earnings (weekly, seasonally adjusted, × 52). Earnings: Average Weekly Earnings, Australia, May 2026, Table 12 (each state’s own figure).
New South Wales has had the highest ratio of any state in every quarter since 2012. It reached 13.34 years in March 2022 and stood at 11.90 years in June 2026. Victoria’s ratio reached 10.30 years in March 2022 and has since fallen to 8.65 years, only 1.24 years above June 2012: Victorian prices have risen 84% since 2012, against 57% for Victorian earnings. Tasmania peaked at 8.66 years in March 2022 and the ACT at 9.72 years in December 2021; both are now more than a year below those highs.
Where the ratio peaked in 2026, and the Northern Territory
Mean dwelling price in years of full-time adult earnings: Queensland, South Australia, Western Australia and the Northern Territory
APN calculation based on Australian Bureau of Statistics data: Total Value of Dwellings, Australia, June quarter 2026, Table 1 (A83728647F and state series A83728607L to A83728642V). Mean price of residential dwellings divided by annual full-time adult ordinary-time earnings (weekly, seasonally adjusted, × 52). Earnings: Average Weekly Earnings, Australia, May 2026, Table 12 (each state’s own figure).
Queensland’s ratio was 6.14 years in June 2012, below the national figure, and 10.65 years in June 2026, above it; its highest was 10.76 years in March 2026. Its rise of 4.51 years is the largest of any state, and it has moved from sixth to second. South Australia reached 9.60 years in March 2026, and Western Australia 9.70 years in June 2026, its highest; Western Australia’s ratio had fallen to 5.21 years in June 2020. The Northern Territory’s ratio, 5.96 years, is below its June 2012 level of 6.24 years: Territory prices have risen 34% since 2012, less than earnings (41%).
The states in June 2026
Mean dwelling price in years of full-time adult earnings, by state and territory, June quarter 2026
APN calculation based on Australian Bureau of Statistics data: Total Value of Dwellings, Australia, June quarter 2026, Table 1 (A83728647F and state series A83728607L to A83728642V). Mean price of residential dwellings divided by annual full-time adult ordinary-time earnings (weekly, seasonally adjusted, × 52). Earnings: Average Weekly Earnings, Australia, May 2026, Tables 2 and 12.
| State or territory | Mean dwelling price, June quarter 2026 | Weekly earnings, May 2026 | Years, June 2012 | Years, March 2022 | Years, June 2026 | Highest quarter |
|---|---|---|---|---|---|---|
| New South Wales | $1,304,900 | $2,108.80 | 7.84 | 13.34 | 11.90 | March 2022 (13.34) |
| Queensland | $1,130,600 | $2,042.20 | 6.14 | 8.86 | 10.65 | March 2026 (10.76) |
| Western Australia | $1,123,700 | $2,227.40 | 6.72 | 6.37 | 9.70 | June 2026 (9.70) |
| South Australia | $979,600 | $1,970.20 | 5.91 | 7.80 | 9.56 | March 2026 (9.60) |
| Victoria | $918,400 | $2,041.10 | 7.41 | 10.30 | 8.65 | March 2022 (10.30) |
| Australian Capital Territory | $981,700 | $2,293.30 | 6.64 | 9.57 | 8.23 | December 2021 (9.72) |
| Tasmania | $733,200 | $1,846.30 | 4.74 | 8.66 | 7.64 | March 2022 (8.66) |
| Northern Territory | $614,400 | $1,984.10 | 6.24 | 6.03 | 5.96 | June 2014 (7.12) |
| Australia | $1,100,400 | $2,083.70 | 6.98 | 10.24 | 10.16 | March 2026 (10.39) |
APN calculation based on Australian Bureau of Statistics data: Total Value of Dwellings, Australia, June quarter 2026, Table 1 (A83728647F and state series A83728607L to A83728642V). Mean price of residential dwellings divided by annual full-time adult ordinary-time earnings (weekly, seasonally adjusted, × 52). Earnings: Average Weekly Earnings, Australia, May 2026, Tables 2 and 12. Highest quarter is the highest ratio since June 2012.
The order has changed since 2012. Then, Victoria had the second-highest ratio and Queensland the sixth; in June 2026 Queensland was second and Victoria fifth. New South Wales has remained first throughout. The rent side of the same comparison, new-lease rents against full-time earnings, is set out in Rent Against Earnings in the June Quarter 2026: Five States Compared.
The reading
The APN Asset-Wage Decoupling Index™ (24610) standardises the national ratio against its 2012 to 2025 average of 8.45 years, with a standard deviation of 1.07 years. At 10.16 years it sits 1.5902 standard deviations above that average. Ranked against all 57 quarters since June 2012, its position is 94.6: three quarters read higher, March 2022, December 2025 and March 2026. The ratio has risen over the period as a whole, so recent quarters tend to rank high; the index is a measure of where the ratio sits in its own history, not a forecast.
What this does not show
The mean price values every dwelling, not only those sold, so it moves with the value of the existing stock rather than with prices paid in each quarter, and it differs from median sale prices. It mixes houses and apartments, so a state with more apartments has a lower average for that reason alone. The earnings are one full-time adult’s ordinary-time pay before tax, not household income, and they exclude part-time workers. Both figures are in current dollars. Because earnings are updated only in May and November, the March and September quarters are measured against earnings six months old, so they tend to read slightly higher than the quarter that follows. State earnings come from a sample survey, so those for the Northern Territory, the ACT and Tasmania carry wider margins of error. The ratio says nothing about interest rates or deposits: what it costs to service a loan on the average dwelling is a separate question. Household incomes by suburb at the 2021 Census are covered in Household Income Across Australia’s Suburbs in 2021.
- Australian Bureau of Statistics (Reference period: June quarter 2026) Total Value of Dwellings, Australia [https://www.abs.gov.au/statistics/economy/price-indexes-and-inflation/total-value-dwellings/jun-quarter-2026], ABS Website, accessed 7 October 2026.
- Australian Bureau of Statistics (Reference period: May 2026) Average Weekly Earnings, Australia [https://www.abs.gov.au/statistics/labour/earnings-and-working-conditions/average-weekly-earnings-australia/may-2026], ABS Website, accessed 7 October 2026.
ABS material is used under a Creative Commons Attribution 4.0 International licence. Calculations, standardisations and index readings are APN’s and are not attributable to the ABS.
Findings are presented on the basis of data and evidence alone.