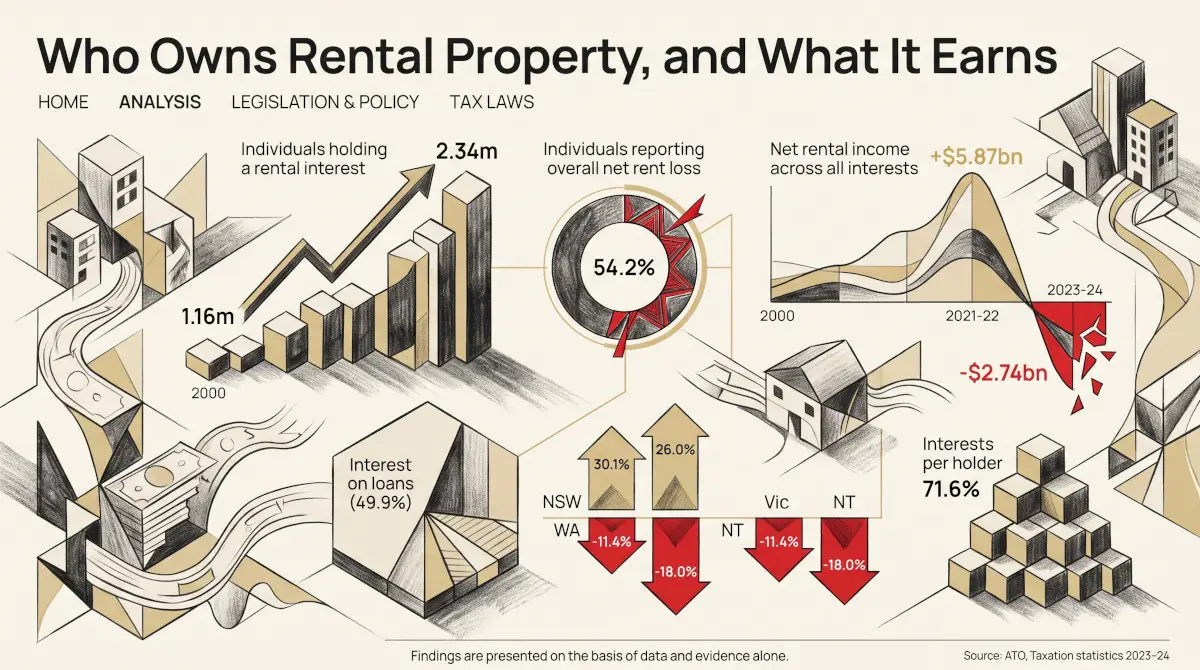

Just over 2.3 million Australians held an interest in at least one rental property in the 2023–24 income year, a little more than double the 1.16 million of 1999–2000. Of those, 54.2% reported an overall net rent loss — within three hundredths of a percentage point of the 54.3% recorded in the first year of the series, after rising to 69.6% in 2007–08 and falling to 41.9% in 2021–22. The figures come from tax returns and are published annually; 2023–24 is the latest available.
Australian Taxation Office, Taxation statistics 2023–24, published 17 June 2026. This is the most recent income year the ATO has published, so the figures here sit about two years behind the quarterly series APN reports elsewhere. APN’s Tax Laws (21310) carries no certified reading, so no node reading is cited in this piece and the figures are anchored on the published source data.
What the measure counts
The Australian Taxation Office publishes the number of individuals who lodged a rental property schedule with their tax return, grouped by how many property interests they held and whether their rental income across all of those properties was, in total, a loss or a neutral-or-profit result. The series runs from the 1999–2000 income year to 2023–24.
Four things about the count matter before any figure is read. It counts interests, not properties: a home owned jointly by two people appears twice, once for each owner, so the 3,403,238 interests recorded in 2023–24 are not 3,403,238 dwellings. It counts individuals: property held through a company, a trust or a self-managed super fund is not in these tables. It is classified by the individual’s own state or territory of residence, not by where the property is, so an owner living in Sydney with a rental property in Brisbane is counted in New South Wales. And it is a schedule-level count assembled from returns processed up to a cut-off date — for 2023–24, the end of October 2025 — so the most recent year is not necessarily complete.
Twice as many holders as at the turn of the century
The number of individuals holding a rental interest rose from 1,163,907 in 1999–2000 to 2,335,540 in 2023–24. Over twenty-five income years it fell in only three: by 1.2% in 2008–09, by 0.01% in 2019–20 and by 0.3% in 2022–23. In each case the following year recovered past the level the series had reached before the fall.
The growth is not evenly spread across the period. The count rose by more than 40,000 in thirteen of the fifteen years to 2014–15, then almost flattened: across the five years from 2018–19 to 2022–23 it moved within a band of about 41,000. It then added 74,460 in 2023–24, the largest single-year increase since 2012–13. Across the twenty-five years the series describes a steady expansion rather than a step change.
Individuals with an interest in a rental property, millions, income years ending 2000 to 2024
Source: ATO, Taxation statistics 2023–24, Individuals Table 27A. Each point is an income year, labelled by the calendar year in which it ends; 2024 is the 2023–24 income year.
The loss share has made a round trip
The share of holders reporting an overall net rent loss is the part of this series that moves. It opened at 54.3% in 1999–2000 and climbed for most of the following decade to 69.6% in 2007–08. It eased to 63.7% by 2009–10, returned to 67.3% in 2010–11, and then declined in every year through the rest of the decade. It fell further again: 53.7% in 2019–20, 47.1% in 2020–21 and 41.9% in 2021–22, the lowest reading in the series.
It has since risen in both of the two following years, to 49.4% in 2022–23 and 54.2% in 2023–24 — 12.4 percentage points above the 2021–22 low, and effectively back where the series began. The cash rate target was 0.10% in April 2022, first rose on 4 May 2022, reached 4.35% on 8 November 2023 and was unchanged at that level through the whole of the 2023–24 income year. Interest on borrowings is much the largest deduction claimed against rental income. The series cannot separate that from rent levels, other holding costs, or changes in who holds the interests, and this piece attributes the movement to none of them.
Share of holders reporting an overall net rent loss, per cent, income years ending 2000 to 2024
Source: ATO, Taxation statistics 2023–24, Individuals Table 27A. The dotted line marks the 1999–2000 reading, the first in the series.
What the interests earn
The ATO began publishing net rental income alongside the interest counts from the 2018–19 income year, so this part of the series is six years long rather than twenty-five. Across all interests together, rental income net of deductions moved from −$3.06 billion in 2018–19 to +$5.87 billion in 2021–22, and back to −$2.74 billion in 2023–24.
The aggregate hides that both sides grew. The average loss on a loss-making interest widened from −$4,407 in 2021–22 to −$8,384 in 2023–24, roughly 1.9 times as large. Over the same two years the average return on a profitable interest also reached its highest of the six, $7,853 against $6,057. Rents and costs both rose; the composition shifted because more interests fell on the loss side of the line, not because the profitable ones earned less.
A separate ATO table sets out what the 3,403,238 schedules reported, and reconciles with the figures above: gross rent of $61.35 billion against total expenses of $64.09 billion. Interest on loans accounts for $31.98 billion of those expenses — 49.9%, or very nearly half of everything claimed, and more than six times the next largest item, capital works deductions at $4.63 billion. Council rates ($4.35 billion), agent fees and commissions ($4.10 billion), body corporate fees ($3.74 billion) and repairs and maintenance ($3.30 billion) follow. Because it is half of all expenses, a movement in interest costs shifts these totals further than an equivalent movement in any other single item would.
Net rental income across all property interests, $ billion, 2018–19 to 2023–24
Source: ATO, Taxation statistics 2023–24, Individuals Table 27A, summed across all interest-count groups. Gold bars are years in which the total was positive, slate bars years in which it was negative.
| Income year | Property interests | Average, loss-making interests ($) | Average, profitable interests ($) | Net rental income, all interests ($bn) |
|---|---|---|---|---|
| 2018–19 | 3,261,955 | −6,220 | 6,458 | −3.06 |
| 2019–20 | 3,252,238 | −5,529 | 6,146 | −0.24 |
| 2020–21 | 3,280,018 | −4,811 | 5,963 | 3.13 |
| 2021–22 | 3,312,985 | −4,407 | 6,057 | 5.87 |
| 2022–23 | 3,286,918 | −6,498 | 7,054 | 1.59 |
| 2023–24 | 3,403,238 | −8,384 | 7,853 | −2.74 |
Source: ATO, Taxation statistics 2023–24, Individuals Table 27A. The two average columns are APN calculations: total net rental income for each group divided by the number of interests in it.
Most holders hold one
The distribution of interests per holder is the most stable thing in the series. In 2023–24, 71.6% of holders held a single interest and 90.4% held one or two. Six or more interests were held by 0.86% of holders, and 2,659 individuals — 0.11% — held ten or more between them, accounting for 1.0% of all interests.
Interests per holder has sat between 1.45 and 1.46 in every one of the six years for which both counts are published, a spread of 0.011. The single-interest share has drifted down slowly over the full twenty-five years, from 76.4% in 1999–2000, and has barely moved since 2012–13. Whatever else changed across the period, the shape of ownership did not.
| Interests held | Individuals | Share of all holders |
|---|---|---|
| 1 interest | 1,672,616 | 71.62% |
| 2 interests | 438,906 | 18.79% |
| 3 interests | 135,327 | 5.79% |
| 4 interests | 48,690 | 2.08% |
| 5 interests | 19,849 | 0.85% |
| 6 interests | 9,127 | 0.39% |
| 7 interests | 4,494 | 0.19% |
| 8 interests | 2,524 | 0.11% |
| 9 interests | 1,348 | 0.06% |
| 10 or more interests | 2,659 | 0.11% |
Source: ATO, Taxation statistics 2023–24, Individuals Table 27A, 2023–24 income year, net rent loss and neutral-or-profit groups combined. Groups of seven interests and above are published separately only from the 2019–20 income year; earlier years stop at “six or more”.
Two jurisdictions have fewer holders than a decade ago
New South Wales accounts for 35.3% of all holders and Victoria 25.7%, together a little over three in five. Measured against 2013–14, six of the eight states and territories have more holders than a decade earlier, New South Wales by 30.1% and Victoria by 26.0%.
Two have fewer. Western Australia has 212,926 holders against 240,408 a decade ago, 11.4% lower and 13.0% below its own high of 244,688 in 2014–15. The Northern Territory has 19,545 against 23,833, 18.0% lower and 21.8% below its 2015–16 high. Queensland is close to flat, 0.3% higher across ten years. These are counts of resident holders, so they reflect where owners live as much as where property is bought; in both jurisdictions the decline begins in the middle of the last decade.
The share of holders in each jurisdiction who hold more than one interest varies less than the counts do, from 24.6% in Western Australia to 31.0% in New South Wales, against 28.4% nationally. A further 68,479 holders were recorded with an overseas address in 2023–24 and 2,854 with an unknown one; both sit outside the state table below.
Change in the number of holders by state and territory, per cent, 2013–14 to 2023–24
Source: ATO, Taxation statistics 2023–24, Individuals Table 27C. Classified by the individual’s state or territory of residence, not by the location of the property. The counts behind each bar are in the table below.
| State or territory | 2023–24 | Share of all holders | 2013–14 | Change over the decade | Holding more than one interest |
|---|---|---|---|---|---|
| NSW | 824,638 | 35.3% | 633,868 | 30.1% | 31.0% |
| Vic | 599,917 | 25.7% | 476,007 | 26.0% | 28.0% |
| Qld | 384,251 | 16.5% | 383,075 | 0.3% | 26.7% |
| WA | 212,926 | 9.1% | 240,408 | −11.4% | 24.6% |
| SA | 135,701 | 5.8% | 132,423 | 2.5% | 25.4% |
| ACT | 50,945 | 2.2% | 43,993 | 15.8% | 30.8% |
| Tas | 36,284 | 1.6% | 32,065 | 13.2% | 25.9% |
| NT | 19,545 | 0.8% | 23,833 | −18.0% | 29.3% |
Source: ATO, Taxation statistics 2023–24, Individuals Table 27C. Shares are of all 2,335,540 holders, including the 71,333 recorded with an overseas or unknown address, so the eight rows do not sum to 100%.
What this measure does not show
It does not count dwellings. Joint owners each lodge a schedule, so an interest is a claim on a property, not a property; the ATO states plainly that the data is not representative of the total number of rental properties. Nor does it count all rental housing: property held in companies, trusts and self-managed super funds is outside these tables entirely, and no figure here is a share of the national rental stock.
It does not identify the cause of anything. A net rent loss is an accounting outcome for one income year, not a measure of whether an investment is sound, and it says nothing about capital gains, which are reported separately and are not in this series. The concessional treatment of rental losses is the subject of several earlier pieces in this category; this one describes who holds the interests and what they reported, and takes no position on the policy.
And it is a late measure. APN’s other series report to quarters ending between September 2025 and June 2026; this one reports the year to June 2024, on returns processed to October 2025 and still subject to revision. Where the two disagree about recent conditions, the quarterly series is the more current. APN has covered the same data family from a different angle in its earlier review of the 2022–23 rental figures.
Findings are presented on the basis of data and evidence alone.