
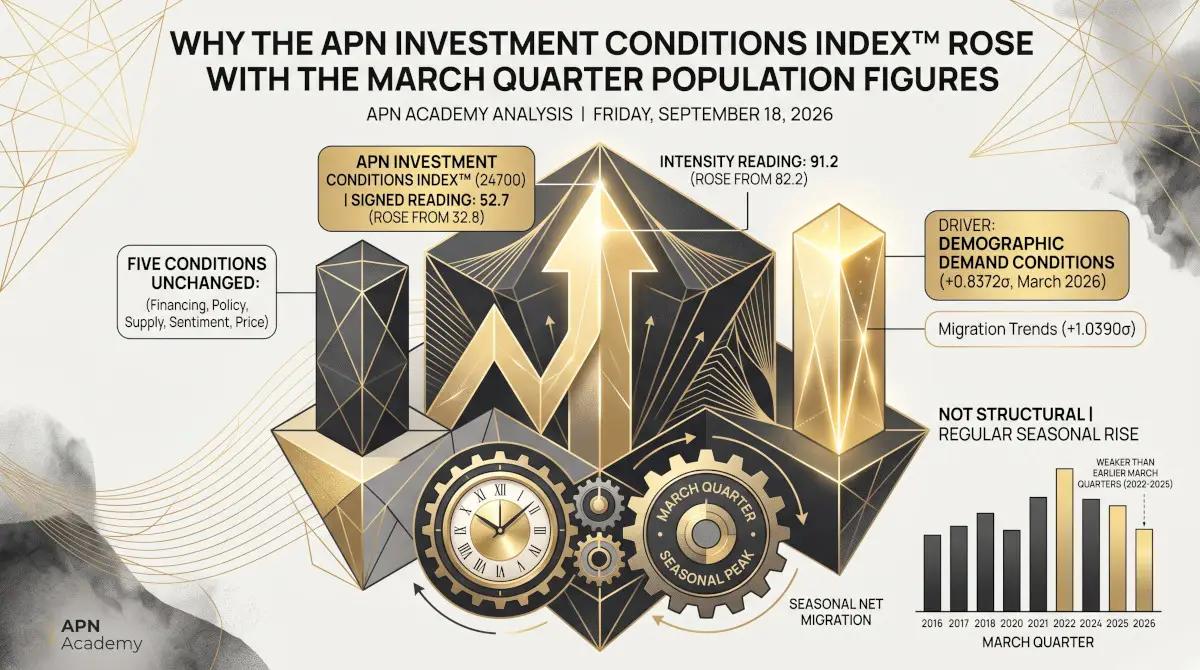

The Signed Reading of the APN Investment Conditions Index™ (24700) rose from 32.8 to 52.7 when the Australian Bureau of Statistics released its March quarter 2026 population figures. Its Intensity Reading rose from 82.2 to 91.2. A 20-point move in the headline reading suggests a broad change in the conditions facing property investment. It was not broad. One of the index’s six conditions changed, Demographic Demand Conditions (24730), and it changed because the latest population figures cover a March quarter, which is when net overseas migration and population growth usually peak.
This piece explains how the index is built, what each of its two readings measures, the arithmetic of the move from 32.8 to 52.7, why the demographic condition rose, and what the reading of 52.7 does and does not say about investment conditions.
The index reads each of its six conditions at its most recent fully reported quarter, from the December quarter 2025 to the June quarter 2026. Each σ figure is APN’s certified reading, measured in standard deviations from its 2011 to 2025 average. Demographic Demand Conditions (24730) ranks at 84.7 against 60 quarters.
What the index measures
The APN Investment Conditions Index™ (24700) summarises the conditions facing residential property investment in Australia in six parts. Each part is itself built from published data:
- Financing & Volatility Conditions (24710): the cost of capital, the flow of credit, lending standards, and volatility in interest rates, inflation and the exchange rate.
- Policy & Regulatory Conditions (24720): the intensity of regulatory enforcement and prudential policy settings.
- Demographic Demand Conditions (24730): population growth and migration flows.
- Supply Pipeline Conditions (24740): dwelling approvals, commencements, work in progress and pipeline congestion.
- Sentiment & Behavioural Conditions (24750): survey sentiment, investor behaviour and household spending.
- Price & Affordability Conditions (24760): dwelling prices and rents, with the value of the dwelling stock in the Intensity Reading only.
Every input is converted to a standardised reading: the number of standard deviations it sits from its own average. That average is taken over 2011 to 2025 where the data allows, and over the period available for inputs that begin later. A reading of zero is an average quarter, +1.0 is one standard deviation above average and −1.0 one below. Standardising puts an interest rate, a count of dwelling approvals and a migration flow on a common scale, so they can be averaged. The six conditions carry equal weight.
The data behind the six conditions is released on different schedules, so the index reads each condition at its most recent fully reported quarter rather than waiting for a quarter in which all six are complete. At present Policy & Regulatory Conditions is read at the December quarter 2025, Sentiment & Behavioural Conditions at the June quarter 2026, and the other four at the March quarter 2026. When a new release completes a quarter for one condition, that condition moves forward and the index is recalculated; the other five keep their existing readings.
Two readings: Signed and Intensity
The index publishes two readings from the same six conditions.
The Signed Reading shows which way conditions lean for investment. Before averaging, each component is counted for or against investment. A higher cost of capital, more volatile interest rates, more intensive regulatory enforcement and a more congested construction pipeline count against. Stronger credit flow, faster population growth, higher migration, more approvals and commencements, and rising dwelling prices and rents count for, read from the investor’s side. On this reading, 50 is an even balance between the conditions working for and against investment; above 50, the balance leans in favour.
The Intensity Reading shows how far conditions sit from their historical centre, without counting any of them for or against. It averages the conditions as measured. A high Intensity Reading says conditions are, taken together, well away from their usual range, not whether that helps or hinders investment.
Before and after the release
The chart below sets out the six conditions on the signed basis, before and after the population release. Five bars are unchanged. Price & Affordability Conditions (+0.98) and Demographic Demand Conditions count for investment; Policy & Regulatory Conditions (−0.91), Sentiment & Behavioural Conditions (−0.34), Supply Pipeline Conditions (−0.26) and Financing & Volatility Conditions (−0.15) count against. Demographic Demand Conditions moved from −0.37 at the December quarter 2025 to +0.84 at the March quarter 2026, a rise of 1.20 standard deviations, and in doing so moved from the against side to the for side.
The six conditions, each counted for or against investment, standard deviations from average
Source: APN calculation from certified condition readings; ABS, National, state and territory population, March quarter 2026. Each condition is read at its most recent fully reported quarter. Demographic Demand Conditions is shown at its December quarter 2025 reading before the release and its March quarter 2026 reading after it; the other five conditions did not change. Positive values count for investment, negative values against.
The arithmetic of 32.8 to 52.7
The Signed Reading is calculated in three steps.
Average the six conditions. After the release the six signed readings average +0.026. With Demographic Demand Conditions at its December quarter reading they average −0.175. Because the index weights each condition equally, a rise of 1.20 in one condition lifts the average by one sixth of that, 0.20. The change in the average is exactly the demographic change divided by six; nothing else contributed.
Scale the average. Six conditions that partly move in opposite directions produce an average that varies much less than any one of them. If the average were converted directly, the index would sit close to 50 almost all the time and understate how unusual conditions are. The index therefore divides the average by the typical spread of an average of these six conditions, estimated from how the conditions have moved together in the quarters where each pair can be compared. Pairs with too few shared quarters take the average of the pairs that can be measured. For the Signed Reading that spread is 0.391.
Convert to a position from 0 to 100. The scaled average is converted with the normal distribution, the bell curve: a scaled value of zero gives 50, one typical spread above average gives 84, and one below gives 16. An average of −0.175 gives 32.8; an average of +0.026 gives 52.7.
How the average of the six conditions converts to the Signed Reading
Source: APN. The horizontal axis is the average of the six signed condition readings, in standard deviations; the curve is the normal distribution after dividing the average by 0.391. Points mark the December quarter 2025 basis (average −0.175) and the latest reading (average +0.026).
The curve is steepest around 50, which is where the index sat. Near the centre, a change of 0.1 in the average moves the Signed Reading by about 10 points. Because each condition carries one sixth of the weight, a single condition moving by 0.6 standard deviations is enough to shift the headline reading by about 10 points, and the rise of 1.20 in Demographic Demand Conditions shifted it by about 20.
The Intensity Reading follows the same steps without the for-and-against counting. Its six conditions average +0.574 after the release, and its typical spread is 0.424, giving 91.2. The demographic rise lifted it by about 10 points. The typical spread is re-estimated whenever the underlying data is updated, and the latest estimate is slightly larger than the one before, which on its own lowers the Intensity Reading by about one point. The same re-estimation moves the Signed Reading by less than a tenth of a point.
Why Demographic Demand Conditions rose
Demographic Demand Conditions (24730) is the average of two standardised inputs from the ABS national population release: net overseas migration in the quarter, and population growth in the quarter. Both are published without seasonal adjustment, and both usually peak in the March quarter. Net overseas migration was 101,000 in the March quarter 2026, against 56,100 in the December quarter; quarterly population growth was 0.47%, against 0.28%.
That rise is the regular March quarter pattern. Net overseas migration has been higher in the March quarter than in the preceding December quarter in every year since 2012, a pattern that lines up with international students arriving ahead of the academic year. As a result, Demographic Demand Conditions has risen from the December quarter to the March quarter in every year shown below, by between 0.56 and 1.35 standard deviations in the years 2012 to 2019. The rise of 1.20 in 2026 is within that range.
Demographic Demand Conditions (24730), reading per quarter, standard deviations from the 2011 to 2025 average
Source: APN calculation from ABS, National, state and territory population, March quarter 2026. The reading is the average of net overseas migration and quarterly population growth, each measured against its own 2011 to 2025 average. March quarters in gold; year labels sit under each March quarter.
Compared with earlier March quarters, the March quarter 2026 is not strong. The reading of +0.84 is below every March quarter reading from 2022 to 2025, which ranged from +1.02 to +2.55. Over the year to March 2026, net overseas migration was 292,100, the lowest twelve-month total since the year to June 2022, and population growth over the year eased to 1.43%. The full detail is in APN’s companion analysis of the March quarter population figures.
A move that recurs every March quarter
Because the index reads Demographic Demand Conditions at its latest quarter, each March quarter population release is likely to lift the Signed Reading, whatever is happening to migration over the year. The chart below illustrates the size of that effect. It takes the index as it stood on the December quarter basis, 32.8, holds the other five conditions at their current readings, and applies the December-to-March rise in Demographic Demand Conditions recorded in each year since 2012.
The Signed Reading if Demographic Demand Conditions rose by each year’s December-to-March rise, other conditions unchanged
Source: APN calculation from certified condition readings; ABS, National, state and territory population, March quarter 2026. An illustration, not a history of the index: each bar starts from the December quarter 2025 basis (32.8) and adds the rise in Demographic Demand Conditions recorded from the December quarter to the March quarter of the year shown. The five other conditions are held at their current readings. 2026 is the rise that occurred.
Every year’s rise would have lifted the Signed Reading, to between 41.1 and 63.0. In most years the rise would have taken the reading into the 40s or to about 50. The rise that occurred in 2026 was larger than in most years and produced 52.7, towards the upper end of the range. The move from 32.8 to 52.7 is larger than usual, but it is the same seasonal move the index makes whenever demographic demand reaches a March quarter.
The effect runs the other way in the June quarter. Demographic Demand Conditions fell from the March quarter to the June quarter in every year from 2012 to 2025 except 2021. Leaving aside 2020 and 2021, when borders were closed, the fall ranged from 0.68 to 1.88 standard deviations.
Change in Demographic Demand Conditions from the March quarter to the June quarter, standard deviations
Source: APN calculation from certified condition readings; ABS, National, state and territory population, March quarter 2026. Each bar is the June quarter reading less the March quarter reading of the same year.
Applied to the current reading with the other five conditions unchanged, falls of that size would take the Signed Reading to between 23.2 and 41.2. The June quarter 2026 population figures are due in December 2026. By then several of the other conditions will also have moved to later quarters, so this is an illustration of the demographic effect, not a projection of the index.
What 52.7 says, and what it does not
A Signed Reading of 52.7 says that, with each condition read at its latest quarter, the conditions counting for investment slightly outweigh those counting against. The margin is narrow: the average of the six signed conditions is +0.026 standard deviations, close to an even balance.
It does not say that conditions for investment improved materially between the December and March quarters. Five of the six conditions did not change. The sixth changed with the season, and against its own history for the time of year it eased. The conditions counting most against investment are unchanged: Policy & Regulatory Conditions, at −0.91, remains the largest single weight on the against side, and Sentiment & Behavioural Conditions, Supply Pipeline Conditions and Financing & Volatility Conditions all remain below zero.
For readers following the index, three habits give a clearer reading than the change from one update to the next:
- Check which conditions moved. A move in the headline reading that comes from one condition says something different from one that comes from several.
- Check which quarter each condition reached. A condition moving from a December quarter to a March quarter, or from a March quarter to a June quarter, carries the seasonal pattern of its inputs.
- Compare demographic readings with the same quarter of earlier years. On that basis the March quarter 2026 is the weakest March quarter since 2021.
The APN Investment Conditions Index™ (24700) page sets out each condition, its components and its latest reading, and the methodology page sets out the construction and its disclosed limitations in full.
Findings are presented on the basis of data and evidence alone.
