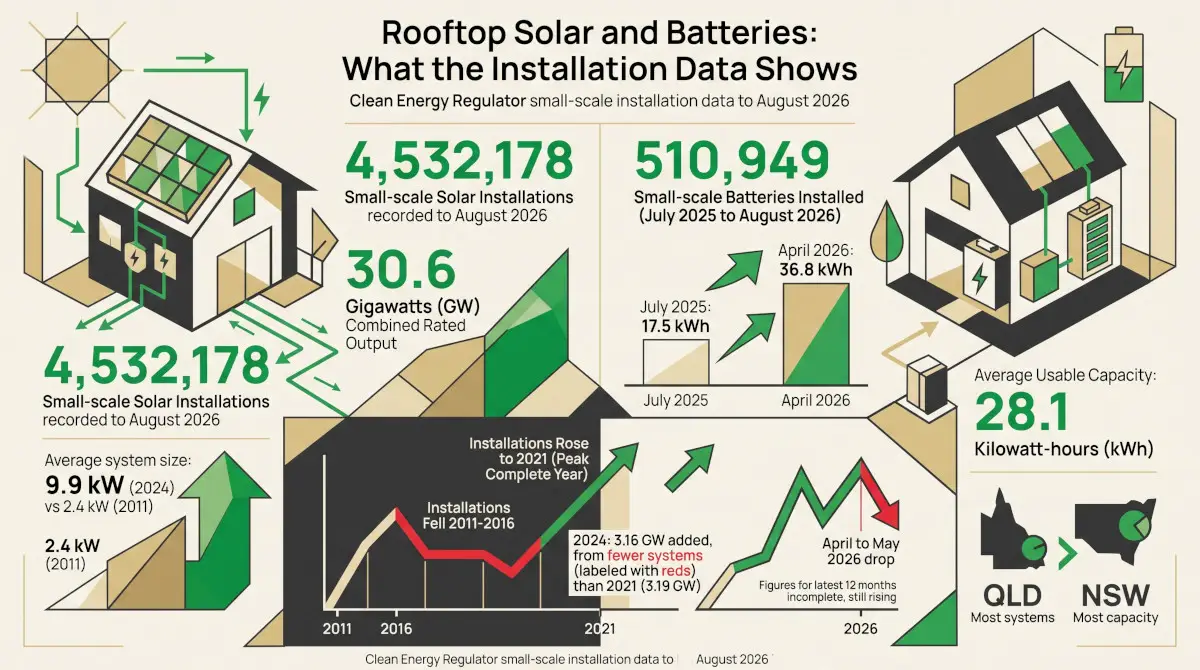

The Clean Energy Regulator had recorded 4,532,178 small-scale solar installations, including upgrades to existing systems, by the end of August 2026, with a combined rated output of 30.6 gigawatts. The systems have grown about fourfold in size since 2011, to an average of 9.9 kilowatts in 2024. Batteries became eligible for the same scheme on 1 July 2025, and 510,949 were installed in the 14 months to August 2026.
Figures for the most recent months will rise, because installers have 12 months to create certificates.
Where the numbers come from
Rooftop solar systems, solar water heaters and, since 1 July 2025, batteries can attract certificates under the Small-scale Renewable Energy Scheme, a Commonwealth scheme. The Clean Energy Regulator publishes every installation that has had certificates created, by the postcode where it was installed and the month it went in. Two features of the data matter for reading it. It counts systems, not homes: a business premises can hold a system, and a home can hold more than one. And installers have 12 months to create certificates, so the regulator notes that figures for the current and previous year will keep rising. In this article the 2025 and 2026 solar totals are shown, but no trend is drawn from them, and every month of battery data is still within its 12-month period.
Twenty-five years of rooftop solar
Small-scale solar installations recorded each year, 2008 to 2026
APN calculation based on Clean Energy Regulator data: Small-scale installation postcode data, solar PV installations, 2008 to August 2026. Systems installed in each calendar year, summed across postcodes. *January to August. Figures for 2025 and 2026 will rise, because installers have 12 months to create certificates.
Installations passed 100,000 a year for the first time in 2010, when 198,208 systems went in, and reached 360,745 in 2011. They then fell in each year to 132,697 in 2016, before rising in each year to 377,458 in 2021, the most of any complete year. Between 2022 and 2024 they ran between 315,717 and 333,865 a year. So far 272,061 systems are recorded for 2025 and 217,634 for January to August 2026, and both figures will rise.
Average size of a small-scale solar system, 2010 to 2024
APN calculation based on Clean Energy Regulator data: Small-scale installation postcode data, solar PV installations and rated power output, 2010 to 2024. Total rated output installed in the year divided by the number of systems.
The systems themselves have grown. The average system installed in 2011 had a rated output of 2.4 kilowatts; by 2024 it was 9.9 kilowatts, and the average rose in every year from 2010 to 2024. That is why capacity added each year has held up while the number of systems has not: 3.16 gigawatts were installed in 2024, close to the 3.19 gigawatts of 2021, from 58,279 fewer systems.
By state and territory
| State or territory | Solar systems, all years | Solar capacity, MW | Average kW per system | Batteries since July 2025 | Battery capacity, MWh |
|---|---|---|---|---|---|
| New South Wales | 1,191,166 | 8,675 | 7.3 | 175,512 | 5,276 |
| Victoria | 906,684 | 6,039 | 6.7 | 102,642 | 2,980 |
| Queensland | 1,220,360 | 8,241 | 6.8 | 103,326 | 2,972 |
| Western Australia | 585,226 | 3,371 | 5.8 | 56,700 | 1,224 |
| South Australia | 466,039 | 3,089 | 6.6 | 56,597 | 1,472 |
| Tasmania | 67,926 | 437 | 6.4 | 5,338 | 106 |
| Australian Capital Territory | 68,762 | 542 | 7.9 | 9,545 | 270 |
| Northern Territory | 26,011 | 228 | 8.8 | 1,289 | 35 |
APN calculation based on Clean Energy Regulator data: Small-scale installation postcode data, all years to August 2026; batteries July 2025 to August 2026. States assigned from the installation postcode using Australia Post ranges; four installations recorded without a valid postcode are excluded.
Queensland has the most systems, 1,220,360, and New South Wales the most capacity, 8,675 megawatts, from larger systems on average. These are counts, not rates: the data does not say how many homes each state has. A share of homes with solar is not published in this data and is NIL RETURN here.
Batteries since July 2025
Small-scale batteries installed each month, July 2025 to August 2026
APN chart based on Clean Energy Regulator data: Small-scale installation postcode data, battery installations, July 2025 to August 2026. Batteries eligible under the Small-scale Renewable Energy Scheme from 1 July 2025. Recent months will rise as certificates are created.
Batteries became eligible for small-scale certificates on 1 July 2025, and the regulator’s battery data begins that month. Recorded installations were 29,509 in July 2025, 45,223 in December, 85,812 in April 2026 and 23,253 in May 2026. Every one of these months is still within the 12-month period for creating certificates, so these are recorded figures, not final ones, and the later months will rise. The data records the numbers but not their cause. New South Wales accounts for 175,512 of the 510,949 batteries, followed by Queensland (103,326) and Victoria (102,642).
The usable capacity of these batteries averages 28.1 kilowatt-hours across the 14 months, and was 17.5 kilowatt-hours for those installed in July 2025 and 36.8 for those installed in April 2026. Recorded solar installations in April 2026, 41,685, were the most in any month since the start of 2025.
What this does not show
The data counts systems that have had certificates created, not every system on a roof: installations outside the scheme are not included, and because it counts installations, it does not show how many systems are still in use. It does not say how many homes have solar or a battery, or how much electricity they produce. Figures for 2025 and 2026 are incomplete. The count includes upgrades to existing systems, which are recorded as installations and also lower the average size per installation. The postcode is the installation address, and assigning postcodes to states follows standard ranges, so the state figures differ slightly from the regulator’s own state tables. The energy ratings of homes themselves are covered in Home Energy Ratings: What Australia Measures.
- Clean Energy Regulator Small-scale installation postcode data (current as at 31 August 2026, last updated 17 September 2026) [https://cer.gov.au/markets/reports-and-data/small-scale-installation-postcode-data], accessed 29 September 2026.
Based on Clean Energy Regulator material licensed under a Creative Commons Attribution 4.0 licence. Calculations are APN’s and are not attributable to the Clean Energy Regulator.
Findings are presented on the basis of data and evidence alone.