Six states and territories brought in the 7-star energy standard for new homes between October 2023 and May 2025. In the year after each start date, house construction prices rose more slowly than in the year before in three of them, New South Wales, the ACT and Victoria, and faster in the other three, Queensland, South Australia and Western Australia. Tasmania, which did not adopt the standard, moved the same way as five of the six over the same windows. The timing gives no consistent sign of a step in prices when the standard started, and the price index may not be built to show one.
Construction Costs & Supply Chain is a broader cost reading than the house construction index used in this article.
The standard and its start dates
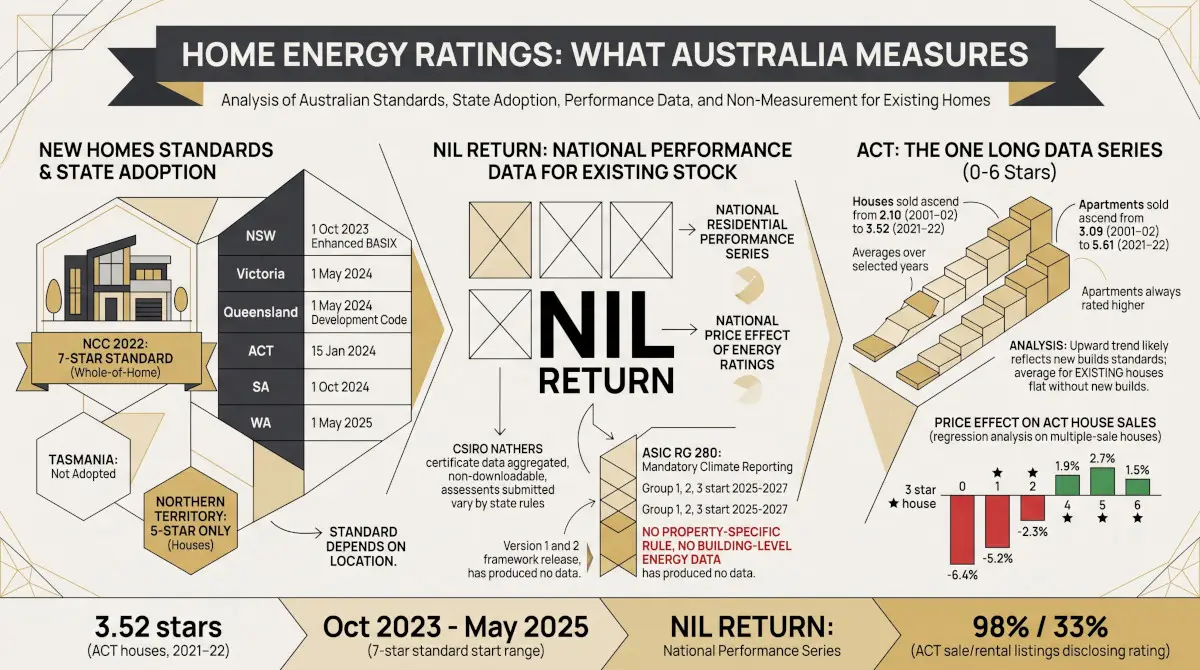
The 2022 National Construction Code raised the energy requirement for new homes to 7 NatHERS stars and added a whole-of-home energy requirement. States brought it in on their own dates. Queensland applies it through its own development code, with 5 stars for eligible small homes of 50 square metres or less and 6 stars for eligible houses with raised floors. Tasmania did not adopt it, and the Northern Territory applied only a 5-star requirement for houses; neither is in the comparison below. When each state adopted the code, and what it measures, is covered in Home Energy Ratings: What Australia Measures.
House construction prices since 2018
House construction prices, Australia, change on a year earlier
APN calculation based on Australian Bureau of Statistics data: Producer Price Indexes, Australia, June quarter 2026, March quarter 2018 to June quarter 2026, Table 17, output of house construction (A2333652F). Percentage change on the same quarter a year earlier, original series.
The ABS producer price index for house construction measures the price builders receive for building a house. Its rise on a year earlier peaked at 20.5% in the September quarter 2022, then slowed to a low of 0.3% in the June quarter 2025, and picked up to 5.9% over the year to June 2026. Every state’s start date falls between that peak and that low, so any comparison sits inside a national slowdown.
Prices in the year before and after each start date
House construction prices in the year before and the year after the 7-star standard started
APN calculation based on Australian Bureau of Statistics data: Producer Price Indexes, Australia, June quarter 2026, four quarters either side of each adoption quarter, Table 17, output of house construction by state. Change in the index over the four quarters to the quarter the standard started, and over the four quarters after it. Adoption dates: Australian Building Codes Board; Queensland Government.
| State or territory | Standard started | Quarter used | Year before | Year after | Australia, year after | Tasmania, year after |
|---|---|---|---|---|---|---|
| New South Wales | 1 October 2023 | December quarter 2023 | 6.9% | −0.2% | 2.8% | −0.2% |
| Australian Capital Territory | 15 January 2024 | March quarter 2024 | 9.9% | −3.0% | 1.1% | −1.2% |
| Victoria | 1 May 2024 | June quarter 2024 | 2.3% | −1.5% | 0.3% | 2.9% |
| Queensland | 1 May 2024 | June quarter 2024 | 1.6% | 2.0% | 0.3% | 2.9% |
| South Australia | 1 October 2024 | December quarter 2024 | 2.5% | 5.2% | 2.3% | 6.9% |
| Western Australia | 1 May 2025 | June quarter 2025 | 5.4% | 8.8% | 5.9% | 11.5% |
APN calculation based on Australian Bureau of Statistics data: Producer Price Indexes, Australia, June quarter 2026, four quarters either side of each adoption quarter, Table 17, output of house construction by state. Change in the index over the four quarters to the quarter the standard started, and over the four quarters after it. Adoption dates: Australian Building Codes Board; Queensland Government.
In New South Wales, the ACT and Victoria, house construction prices rose more slowly in the year after the standard started than in the year before, and more slowly than the national index over the same year. In Queensland, South Australia and Western Australia they rose faster after than before, and faster than the national index. Tasmania, where the standard did not apply, slowed in the windows around the New South Wales, ACT and Victorian start dates and quickened in those around South Australia and Western Australia, the same direction as the adopting state in five of the six cases. Queensland is the exception: over the same window as Victoria’s, Queensland quickened while Tasmania slowed.
That pattern is consistent with a common price cycle across states, and it gives no consistent sign of an extra rise when the standard began. It does not rule one out. Whether the index could show one is a separate question.
What the price index can and cannot show
The ABS adjusts producer prices for changes in the quality or specification of what is priced, “wherever possible”, so that the index records only pure price change. Its consumer price methodology sets out how costs imposed by regulation are handled: unless a change clearly affects the level of household utility, it is not treated as a quality change, so a higher price caused by a mandatory requirement counts as a price increase. The producer price methodology does not say how a mandatory energy standard for houses is treated. An energy standard arguably does affect utility, through running costs, so it cannot be assumed that the index carries the full cost of meeting it.
The index also measures the price received for houses being built in each quarter. A house priced in the year after a start date may have been approved before it, under the earlier standard. And the house construction price includes any grants, rebates or subsidies the buyer received: it is not reduced by them.
What this does not show
This is a comparison of timing, not a measure of what the standard costs. Prices moved for many reasons across 2023 to 2025, and one year either side of a date cannot separate them. Tasmania is not a control group: it differs from the other states in its market, its builders and its costs. The index measures house construction only, not apartments, and it is state-wide. A direct estimate of the cost of building to 7 stars would need builder or design-level data, which is not published here.
- Australian Building Codes Board NCC 2022 state and territory adoption dates [https://www.abcb.gov.au/ncc-2022-state-and-territory-adoption-dates], accessed 29 September 2026.
- Australian Bureau of Statistics (Reference period: 2025) Consumer Price Index: Concepts, Sources and Methods, Quality change and new products [https://www.abs.gov.au/statistics/detailed-methodology-information/concepts-sources-methods/consumer-price-index-concepts-sources-and-methods/2025/quality-change-and-new-products], ABS Website, accessed 30 September 2026.
- Australian Bureau of Statistics (Reference period: June quarter 2026) ‘Table 17. Output of the Construction industries, subdivision and class index numbers’ [data set], Producer Price Indexes, Australia [https://www.abs.gov.au/statistics/economy/price-indexes-and-inflation/producer-price-indexes-australia/jun-2026], accessed 30 September 2026.
- Australian Bureau of Statistics (Reference period: June quarter 2026) Producer Price Indexes, Australia methodology [https://www.abs.gov.au/methodologies/producer-price-indexes-australia-methodology/jun-2026], ABS Website, accessed 30 September 2026.
- Queensland Government Energy equivalence building standards (star and whole of home ratings) [https://www.business.qld.gov.au/industries/building-property-development/building-construction/laws-codes-standards/sustainable-housing/energy-equivalence], accessed 30 September 2026.
ABS material is used under a Creative Commons Attribution 4.0 International licence. Calculations, standardisations and index readings are APN’s and are not attributable to the ABS.
Findings are presented on the basis of data and evidence alone.