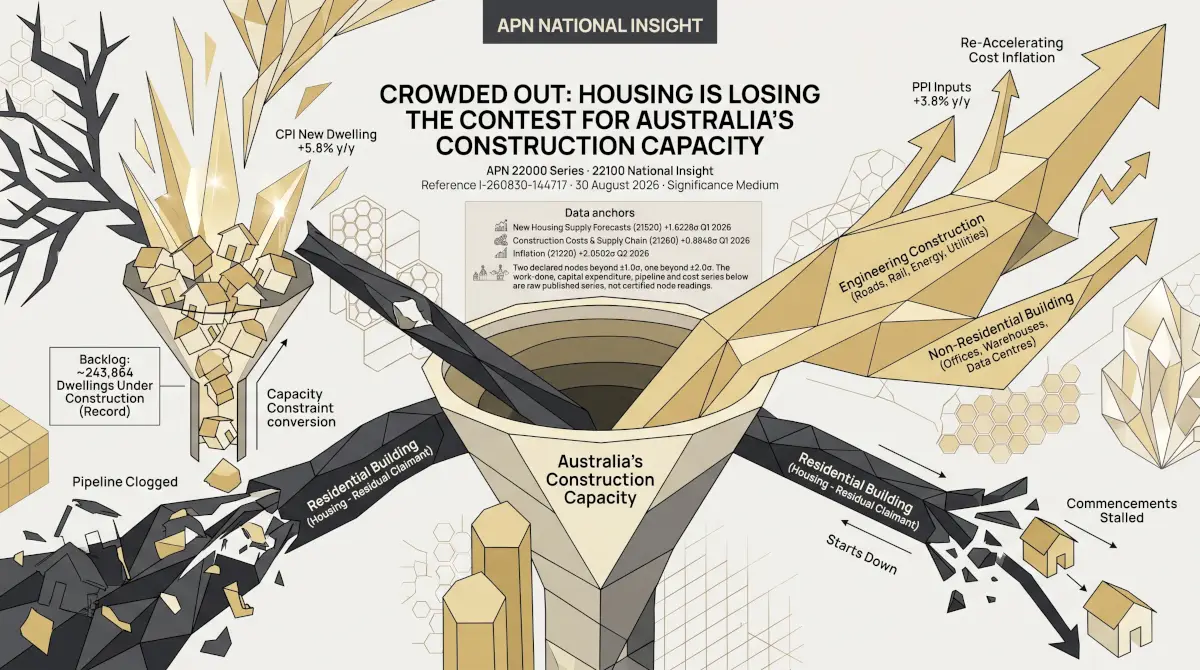
The Construction Paradox: Approvals Accelerate While Starts Stall
Inflation (21220) +2.1049σ Q2 2026
New Housing Supply Forecasts (21520) +1.6228σ Q1 2026
Scope and Purpose
Four data points landed within days of each other in August 2026: the July CPI print, the June quarter Construction Work Done release, the June quarter Building Approvals and Building Activity data, and the NAB Residential Property Survey. Read separately, each tells a partial story. Read together, they describe a construction sector running on a pipeline built up over the past year, showing the first clear signs of strain in converting that pipeline into new starts, at the same time the professionals building it have turned sharply pessimistic. This output sets out what the certified and raw data actually show, and what they don’t yet show.
The Inflation Backdrop
Inflation (21220) reads Z +2.1049σ at Q2 2026, one of two declared node anchors for this output — a quarterly composite of headline CPI, Housing CPI, construction PPI and inflation expectations, current to June 2026 and not yet updated for the September quarter. The July monthly CPI indicator, reported separately by Australian Property Network (APN) this week, showed headline inflation easing to 3.5% while the Trimmed Mean held at 3.6% — and within Housing, New Dwelling Purchase costs were the fastest-moving sub-component APN tracks, up 3.0% in six months. That cost backdrop is the frame for everything below: building costs are still climbing, not stabilising.
A Genuine Building Boom, on One Measure
ABS Construction Work Done, Australia (Preliminary) for the June 2026 quarter shows a clear split by construction type. Building work — residential and non-residential combined — rose to $45.8 billion, up 10.0% on a year earlier in seasonally adjusted chain volume terms (residential alone: +9.1%; non-residential: +11.5%). Engineering construction fell to $36.7 billion, down 5.1% over the same year, dragging the national total down 2.1% for the quarter despite the building-side strength. Read on its own, the building figure describes a genuine upswing in residential and commercial construction activity — not a sector in retreat.
APN’s own New Housing Supply Forecasts node (21520) blends this data with Dwellings Under Construction and the Value of Work Yet To Be Done, and reads Z +1.6228σ for the March 2026 quarter, up from +0.9112σ a year earlier — one quarter behind the June quarter data discussed above, and built on the residential-only cut of Construction Work Done ($27.4 billion for the March quarter), not the combined residential-and-non-residential figure this piece has been discussing, to stay consistent with the node’s existing housing-only scope.
But Approvals and Starts Are Pulling Apart
Value of work done is a lagging measure — it reflects a pipeline of projects already under way. The leading indicator, dwelling approvals, tells a more forward-looking story, and when compared on a consistent seasonally adjusted basis against Building Activity Australia’s commencement data, a gap opens up. National dwelling approvals reached 52,793 (seasonally adjusted, June quarter 2026), up 8.8% on a year earlier and still climbing quarter on quarter. Dwelling commencements — actual construction starts — sat at 48,012 for the March 2026 quarter (Building Activity’s most recent, one quarter behind Construction Work Done), essentially flat year-on-year at +0.2%, after falling 11.2% from the December 2025 quarter.
Dwelling Approvals vs Commencements, Seasonally Adjusted, Sep 2024 – Jun 2026
Source: ABS 8731.0 Building Approvals Australia (Table 6, national total dwelling units approved, seasonally adjusted) and ABS 8752.0 Building Activity Australia (Table 33, national total dwellings commenced, seasonally adjusted), quarterly. Dashed segment: June 2026 approvals are available, but Building Activity’s June 2026 commencements are not due until 7 October 2026 — that gap cannot yet be checked.
The two series aren’t cleanly diverging in a straight line — commencements spiked in December 2025 before the March 2026 fall, so there’s real quarter-to-quarter noise in the starts data. But the underlying picture holds on a year-on-year basis: approvals are accelerating (+8.8%) while commencements are flat (+0.2%). Whether that gap is a genuine, building capacity constraint (labour, materials, finance availability) or simply lumpy timing will only become clear once the June 2026 commencements figure lands on 7 October — the next scheduled Building Activity release, and the figure to watch most closely coming out of this piece.
The Professionals Have Already Turned
Set against that data, the NAB Residential Property Survey — a quarterly survey of roughly 250 property professionals, including developers, agents and asset managers — has moved sharply. Its national sentiment index fell from +65 in the December 2025 quarter to +58 in March 2026, then fell to +14 in the June 2026 quarter, NAB’s own commentary attributing the fall to investor-housing tax changes announced in the Federal Budget. This is a forward-looking survey measure, not yet reflected in any hard construction data — the approvals and work-done figures above describe decisions largely made before the sentiment shock, not after it.
NAB Residential Property Survey — National Sentiment Index, Feb 2025 – May 2026
Source: NAB Quarterly Australian Residential Property Survey, national headline net-balance index. Red bar marks the June 2026 quarter fall — a two-quarter fall from the cycle high, attributed by NAB to investor-housing tax changes in the Federal Budget.
APN Analytical Synthesis
The balance of evidence across these four sources is structurally consistent with a construction sector still working through a pipeline built up over the prior year — approvals climbing, a large stock of dwellings mid-construction, and building-side work-done up double digits year-on-year — at the same time as three independent signals point toward strain ahead: commencements failing to keep pace with approvals growth, per-unit completion costs (CPI’s New Dwelling Purchase measure) rising faster than any other tracked component, and the professionals closest to the pipeline turning sharply pessimistic within the space of two quarters.
None of these signals, alone, would justify a call that the building boom is ending. Together, they are consistent with a pipeline that is still delivering on decisions made twelve to eighteen months ago, while the decisions being made today are responding to a materially different, more cost-constrained and tax-affected environment. This synthesis speaks only to the structural conditions the cited data can independently support; it does not constitute a view on future construction volumes or prices, and no such view is expressed or implied. The 7 October 2026 Building Activity release, carrying the June quarter commencements figure, is the next data point that will test this reading directly.
Disclaimer
The analysis and information contained in this publication are for general informational and strategic purposes only and do not constitute financial, investment, legal, or any other form of professional advice. Australian Property Network is not a licensed financial advisor. Property values and market conditions can go up or down. Before making any property or investment decisions, you must conduct your own thorough research and seek independent professional advice tailored to your specific circumstances.