Consumer prices rose 4.0% over the year to August 2026, up from 3.5% in July, and the housing group rose faster still, 5.7%. Housing costs contributed 1.24 percentage points of the 4.0% rise. Across the capital cities the housing rise ranged from 4.5% in Melbourne to 7.9% in Adelaide, and it outpaced the city’s overall inflation in all eight. The components diverged further: electricity rose 2.4% in Perth and 22.6% in Darwin, the price of a new home 3.1% in Melbourne and 9.8% in Hobart, and rents 1.4% in Canberra and 6.3% in Darwin.
The CPI figures here are published ABS data for August 2026; the node reading is APN’s certified reading for the June quarter.
The August figures
The ABS Consumer Price Index for August 2026, released on 30 September, put annual inflation at 4.0%, up from 3.5% in July. The trimmed mean, which sets aside the largest price rises and falls each month, was 3.6%, unchanged. Two items account for more than the whole rise in the annual rate, which was 0.51 of a percentage point: automotive fuel added 0.45 of a point more to it than in July, and electricity 0.16. The ABS attributes fuel’s 14.8% rise in the month to higher world oil prices and the end of the remaining fuel excise relief. The housing group rose 5.7% over the year, up from 5.0% in July.
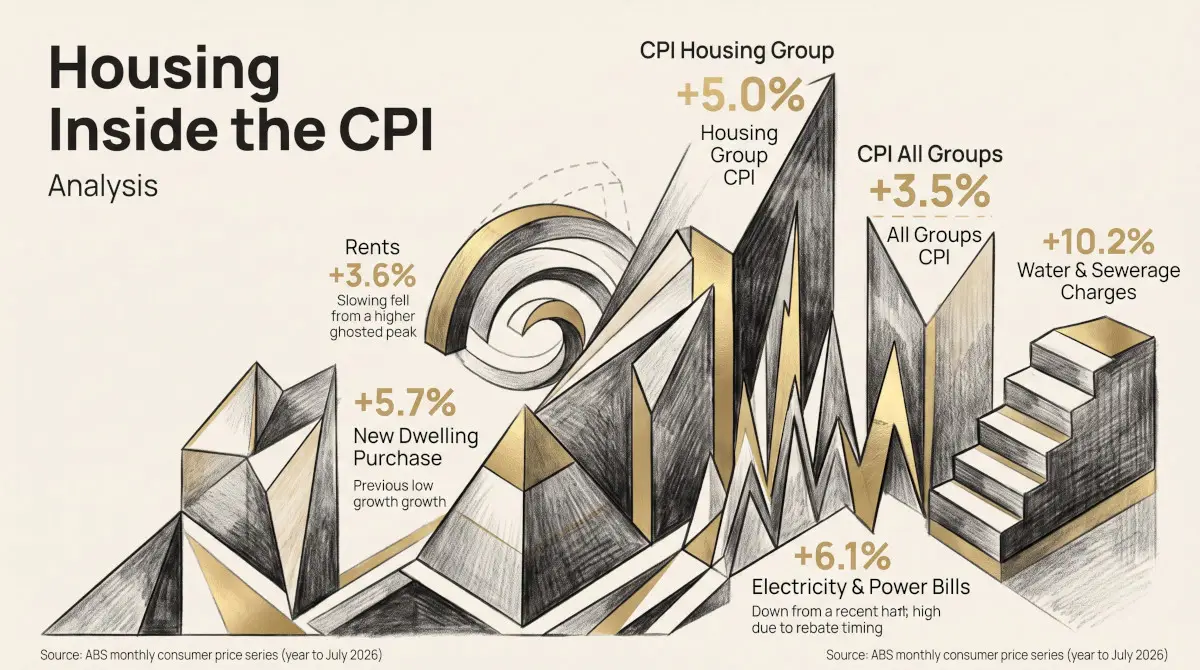
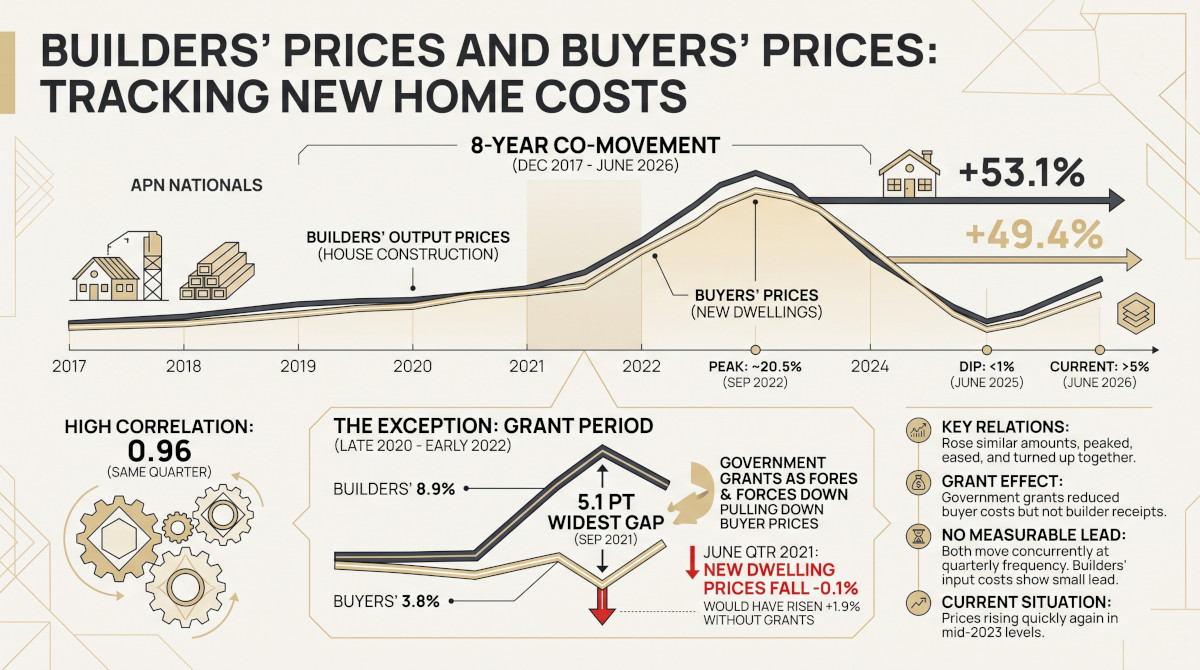
The CPI housing group measures what households pay to occupy a home: rents, the price of a newly built home for owner-occupiers, property rates, water, electricity and gas, and maintenance. It excludes mortgage interest and the price of established homes and land. How its parts have moved nationally since 2023 is set out in Housing Inside the CPI: What Rents, New Homes and Power Bills Are Doing; this piece looks at August and at the capital cities.
What drove the housing rise
Contributions of the housing components to annual CPI inflation, August 2026
APN chart based on Australian Bureau of Statistics data: Consumer Price Index, Australia, August 2026, Table 4. Contribution to the 4.0% annual change in the all-groups CPI, percentage points, weighted average of eight capital cities.
Three components carried most of the housing contribution. The price of new homes rose 5.4% over the year, up from 0.7% a year earlier; the ABS attributes the rise to project home builders raising base prices to pass on higher labour and materials costs. Electricity rose 13.2%, which the ABS says is largely due to the ending of Commonwealth electricity rebates; the July figure of 6.1% was lower because of when rebate payments fell in 2025. Rents rose 3.6%, unchanged since May.
Annual change in electricity, new dwelling purchase and rents, October 2022 to August 2026
APN chart based on Australian Bureau of Statistics data: Consumer Price Index, Australia, August 2026, Table 3 (A130390732J, A130391537V, A130390095C). Change from the same month a year earlier, weighted average of eight capital cities. Rents from July 2023, the first month with an annual change.
Electricity’s annual rate has swung widely over the period, from −35.6% in October 2024 to 37.1% in October 2025. Rent increases have eased from 7.8% in August 2023 and have held at 3.6% for four months.
Capital by capital
Housing group, annual change by capital city, August 2026
APN chart based on Australian Bureau of Statistics data: Consumer Price Index, Australia, August 2026, Table 11. Housing group, change from August 2025 to August 2026.
| Capital city | All groups | Housing | Rents | New dwelling purchase | Electricity |
|---|---|---|---|---|---|
| Adelaide | 4.7% | 7.9% | 4.1% | 6.7% | 21.4% |
| Darwin | 4.5% | 7.6% | 6.3% | 6.4% | 22.6% |
| Hobart | 4.8% | 7.2% | 3.1% | 9.8% | 14.4% |
| Brisbane | 4.1% | 6.2% | 4.7% | 8.3% | 5.9% |
| Sydney | 3.9% | 5.9% | 3.5% | 4.9% | 13.2% |
| Perth | 4.3% | 5.5% | 5.3% | 8.1% | 2.4% |
| Canberra | 4.1% | 5.4% | 1.4% | 5.3% | 19.5% |
| Melbourne | 3.5% | 4.5% | 2.5% | 3.1% | 16.8% |
| Eight capitals | 4.0% | 5.7% | 3.6% | 5.4% | 13.2% |
Source: Australian Bureau of Statistics, Consumer Price Index, Australia, August 2026, Tables 1 and 11. Change from August 2025 to August 2026, original series.
Adelaide (7.9%), Darwin (7.6%) and Hobart (7.2%) had the largest housing rises, and Melbourne (4.5%) the smallest. Electricity accounts for much of the spread: it rose 22.6% in Darwin, 21.4% in Adelaide and 19.5% in Canberra, but 5.9% in Brisbane and 2.4% in Perth. New home prices rose fastest in Hobart (9.8%), Brisbane (8.3%) and Perth (8.1%), and slowest in Melbourne (3.1%). Rent increases ranged from 1.4% in Canberra to 6.3% in Darwin, with Perth next at 5.3%.
Two measures of rent
The CPI rents figure covers all tenancies, including those whose rent has not changed for months, so it moves more slowly than rents on new leases. Bond data for the five states APN tracks show new-lease rents up 5.7% over the year to the June quarter 2026, set out in New-Lease Rents in the June Quarter 2026: Five States Compared. The two measures cover different leases and areas (the CPI covers the eight capital cities; the bond measure whole states), so they are not directly comparable, but both show rents still rising.
What this does not show
Capital-city price indexes show how prices changed in each city, not whether prices are higher in one city than another. The CPI covers the eight capital cities only. The reasons given for electricity, fuel and new home prices are the ABS’s. Monthly CPI figures can be revised, and the September figures, with the September quarter, are due on 28 October. Inflation (21220) standardises price-index levels, which rise as prices accumulate, so its reading is best read together with the annual rates above.
- Australian Bureau of Statistics (Reference period: August 2026) Consumer Price Index, Australia [https://www.abs.gov.au/statistics/economy/price-indexes-and-inflation/consumer-price-index-australia/aug-2026], ABS Website, accessed 30 September 2026.
ABS material is used under a Creative Commons Attribution 4.0 International licence. Calculations, standardisations and index readings are APN’s and are not attributable to the ABS.
Findings are presented on the basis of data and evidence alone.