
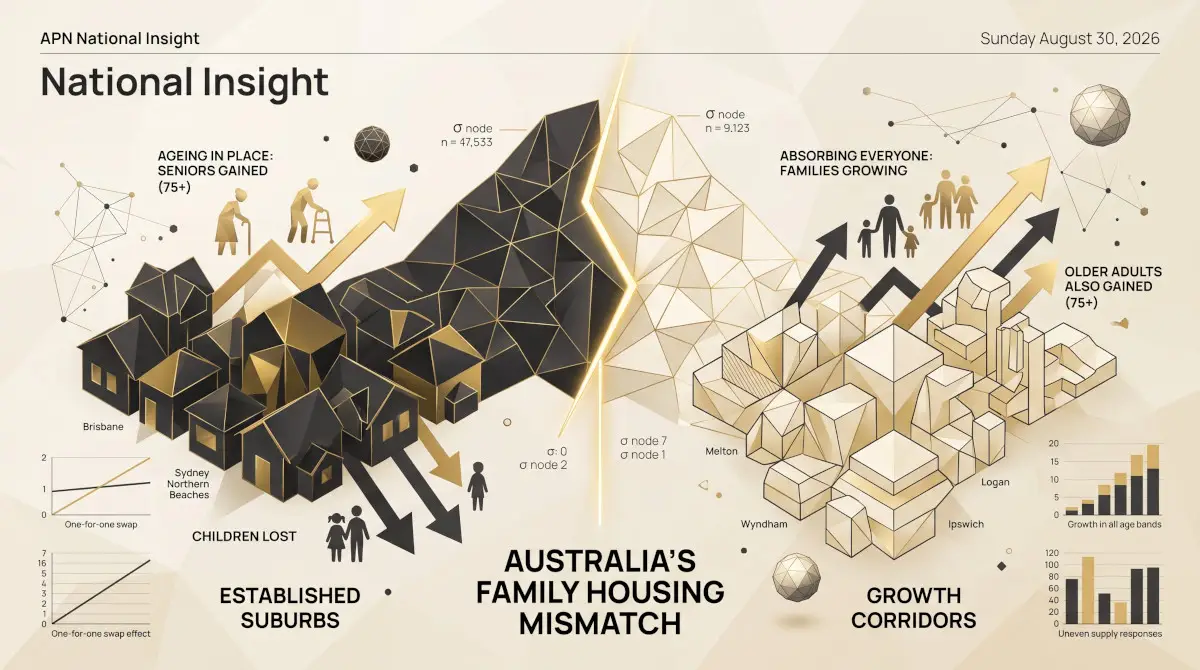

Australia’s Family Housing Is in the Wrong Place — and Getting More So
Ageing Population & Housing Needs (21420) +1.4666σ Q3 2025
Construction / Supply Pipeline (21520) +1.6228σ Q1 2026
Scope and Purpose
In the year to 30 June 2025, Australia added 419,000 people. It added just 10,900 children under 15 — a rise of 0.2% against national growth of 1.5% — while the population aged 75 and over grew by 4.2%, more than double any other age band. The national picture has been widely reported. What has not is where it is happening. The ABS’s 2025 Regional Population by Age and Sex release is the first that allows a like-for-like, council-by-council comparison of age structure against the 2024 edition, and this output sets out what that comparison shows when read alongside the same year’s building approvals.
The short version: the country is splitting into two housing markets with opposite demographic problems, and the new-dwelling pipeline is only partly responding to either.
The Established Suburbs Are Ageing in Place
Of the 546 local government areas that can be matched across both years, 307 — more than half — lost children under 15. That is not a story of decline: 235 of those 307 grew in total population and gained residents aged 75 and over at the same time. They are not emptying. Their existing housing is simply being occupied by older and smaller households than it was built for.
Among councils of more than 50,000 people, the largest losses of children are concentrated in the established, expensive and coastal parts of the capitals and regional cities. Brisbane lost 2,674 under-15s and gained 2,666 residents over 75 — almost a one-for-one swap inside a city that grew by 19,700. The Gold Coast lost 1,027 children and gained 2,572 over-75s. The same pattern runs through Sydney’s Northern Beaches, Hornsby and Ku-ring-gai, Melbourne’s Boroondara and Bayside, Adelaide’s Salisbury and Onkaparinga, and Cairns. In every one of these councils children now make up only 14–18% of residents.
The Growth Corridors Are Absorbing Everyone
The councils gaining children are the outer growth corridors, and almost nowhere else. Melton added 2,938 under-15s in a single year, Wyndham 2,447, Casey 1,477, Hume 1,281, Logan 1,184, Blacktown 1,140, Greater Geelong 1,092, Camden 1,079, Ipswich 1,002 and Whittlesea 988. Children are 21–25% of the population in these areas — a share roughly a third higher than in the established suburbs.
Where the Children Went: Ten Largest Gains and Losses in Under-15 Population, Councils over 50,000 Residents, Year to 30 June 2025
Source: ABS 3235.0 Regional Population by Age and Sex, Australia, 2025 and 2024 editions, estimated resident population by local government area. Gold bars: change in persons aged 0–14. Blue bars: change in persons aged 75 and over. Every council shown grew in total population over the year.
The less expected finding is that the corridors are also where the over-75 population is growing fastest in percentage terms: 10.3% in Melton, 7.9% in Wyndham, 7.6% in Camden. The growth corridors are not simply a young-family phenomenon. They are absorbing every age group, because they are where the dwellings are.
At state level, Victoria’s growing councils gained 13,800 children while its shrinking ones lost 4,000; New South Wales gained 8,600 against a loss of 6,000. Queensland, despite the fastest total growth of the large states, lost children on net (−0.4%), as did South Australia (−0.5%) and Tasmania (−0.9%). Queensland’s growth is now an adult and older-adult story; its family growth is confined to Logan and Ipswich.
Is Supply Following the Children?
Building approvals for the same financial year show that new supply does follow family growth — but only moderately. Across the 229 councils with more than 20,000 residents, the correlation between under-15 growth and approvals per 1,000 residents is r = 0.41; against total population growth it is r = 0.55. Correlation is not causation, and approvals lag household formation, but the relationship is positive and far from tight.
The corridors themselves are broadly keeping pace. Melton, Wyndham, Casey, Logan, Ipswich and Whittlesea each approved between 9 and 21 dwellings per 1,000 residents over the year — roughly one approval for every 2 to 2.7 new residents. The exceptions are in Sydney. Blacktown approved 5.6 dwellings per 1,000 residents, one for every 4.3 new arrivals, and Camden one for every 3.3 — the weakest supply response of any major corridor in the country.
The established councils tell a different story. Brisbane approved 5.4 dwellings per 1,000 residents and the Gold Coast 6.0, both in step with their population growth — but the recent growth in those approvals has been unit-led, not in the family dwellings whose occupants are ageing out of them. Sydney’s Northern Beaches (1.9 per 1,000) and Hornsby (2.5) are approving almost nothing relative to their size while losing 2% of their children a year.
APN Analytical Synthesis
The balance of evidence is structurally consistent with a mismatch that is demographic rather than cyclical. Detached family housing stock is concentrated in councils whose residents are ageing and whose child populations are falling, and that stock is not being released; family formation is being pushed to the growth corridors, which are building — unevenly — to meet it. The density debate in established suburbs is usually framed as a question of housing numbers. This data suggests it is at least as much a question of housing type: the established suburbs hold the family homes, and the families are increasingly elsewhere.
Two cautions apply. Annual changes in ABS regional population estimates by age are modelled and subject to revision, so the figures above should be read as direction and ranking rather than precise counts. And a falling child population reflects cohort ageing and lower birth rates as well as outward movement — though the housing implication, fewer child-occupied dwellings and more small older households on the same stock, holds in either case. This synthesis speaks only to the structural conditions the cited data can independently support; it does not constitute a view on future prices or planning outcomes in any council, and no such view is expressed or implied. The 2026 edition of the same ABS release, due mid-2027, is the data point that will test whether this divergence is widening.
Disclaimer
The analysis and information contained in this publication are for general informational and strategic purposes only and do not constitute financial, investment, legal, or any other form of professional advice. Australian Property Network is not a licensed financial advisor. Property values and market conditions can go up or down. Before making any property or investment decisions, you must conduct your own thorough research and seek independent professional advice tailored to your specific circumstances.
