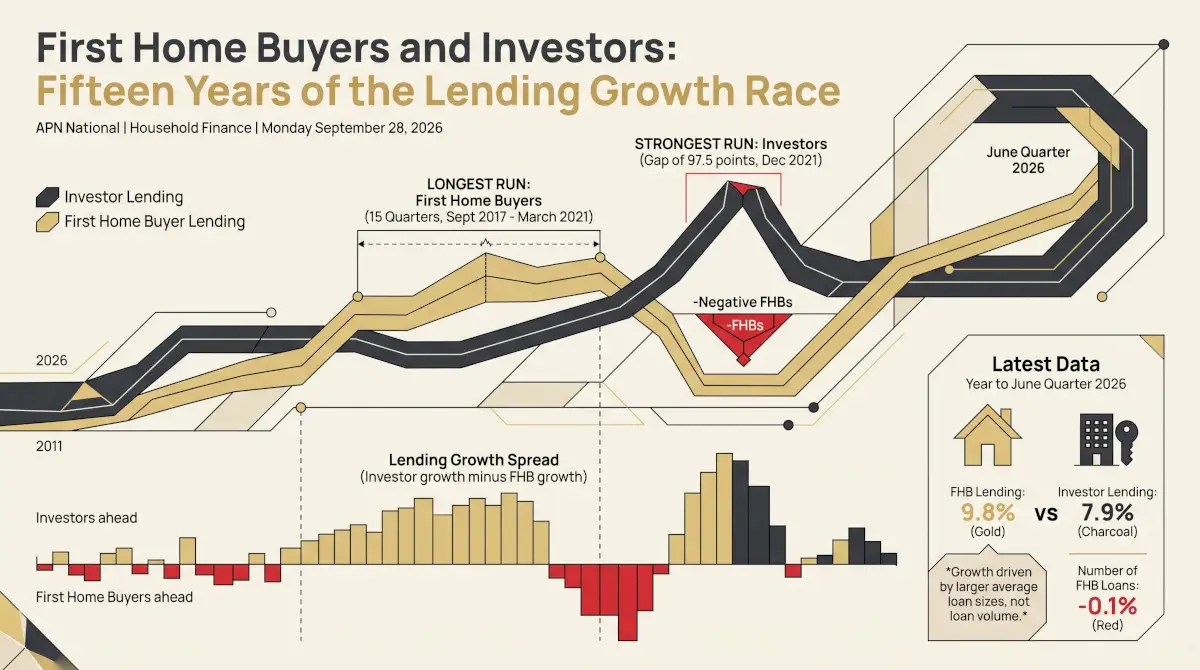

First home buyers and investors both borrow to buy housing, but their lending rarely grows at the same pace. Across the 62 quarters since the start of 2011, the value of new loans to first home buyers grew faster than lending to investors in 31, exactly half. The lead has changed hands nine times. In the June quarter of 2026 it changed again: first home buyer lending grew 9.8% over the year and investor lending 7.9%, the first quarter since 2023 in which first home buyers were ahead. Almost all of that growth came from larger loans, not more of them.
Values of new loan commitments in current dollars, original series, excluding refinancing.
What is being compared
The ABS publishes the value of new housing loan commitments each quarter, split by who is borrowing. Two groups are compared here: first home buyers borrowing to live in the home, and investors borrowing to buy dwellings to rent out. Both exclude refinancing. For each group the measure is annual growth, the value of new commitments in a quarter against the same quarter a year earlier, which removes the seasonal pattern in the original series. The spread is investor growth less first home buyer growth: positive when investor lending is growing faster, negative when first home buyer lending is.
Values are in current dollars, so they grow when loans get larger as well as when there are more of them. How many loans were written is examined below. The share of owner-occupier loans going to first home buyers, which measures something different, is set out in Twenty-Four Years of First Home Buyer Lending, together with the history of first home buyer schemes and concessions since 2002.
Fifteen years of growth rates
Annual growth in the value of new housing loan commitments, investors and first home buyers
Per cent, value of new loan commitments against the same quarter a year earlier, March quarter 2011 to June quarter 2026, original, excluding refinancing. Source: ABS, Lending Indicators, June quarter 2026, tables 13 and 24.
Both lines swing widely, and they often swing apart. Investor lending growth peaked at 96.2% in the year to June 2021. By December 2021 it was still 89.8%, while first home buyer lending had turned down, by 7.7%: the widest gap since 2011. The widest gap in the other direction came in the year to March 2018, when first home buyer lending was growing and investor lending contracting.
The spread and its episodes
Investor lending growth less first home buyer lending growth
Percentage points, March quarter 2011 to June quarter 2026. Positive: investor lending growing faster. Negative: first home buyer lending growing faster. Source: ABS, Lending Indicators, June quarter 2026, tables 13 and 24.
The spread moves in long runs rather than quarter by quarter. The longest run with first home buyers ahead lasted 15 quarters, from September 2017 to March 2021, and reached a gap of 58.9 points in March 2018. It was followed by the strongest run the other way: in the six quarters from June 2021 investor lending grew up to 97.5 points faster, in December 2021. The most recent investor-led run lasted nine quarters, from March 2024 to March 2026.
| Quarters | Faster-growing group | Quarters in run | Widest gap (points) |
|---|---|---|---|
| June 2011 to September 2012 | First home buyers | 6 | −28.8 |
| December 2012 to June 2015 | Investors | 11 | 35.3 |
| September 2015 to June 2016 | First home buyers | 4 | −24.5 |
| September 2016 to June 2017 | Investors | 4 | 34.5 |
| September 2017 to March 2021 | First home buyers | 15 | −58.9 |
| June 2021 to September 2022 | Investors | 6 | 97.5 |
| December 2022 to December 2023 | First home buyers | 5 | −16.3 |
| March 2024 to March 2026 | Investors | 9 | 21.6 |
| June 2026 | First home buyers | 1 | −2.0 |
Runs of consecutive quarters in which one group’s lending grew faster than the other’s, measured as annual growth in the value of new loan commitments. The widest gap is investor growth less first home buyer growth; negative values mean first home buyer lending grew faster. The run beginning in March 2011 is not shown. Source: ABS, Lending Indicators, June quarter 2026, tables 13 and 24, original.
Some of these runs line up with changes to first home buyer support; others do not. The Commonwealth’s deposit guarantee scheme began in 2020, and HomeBuilder grants applied to building contracts signed between 4 June 2020 and 31 March 2021; both fall inside the long first home buyer run, which had begun more than two years earlier. From 1 October 2025 the scheme, now the 5% Deposit Scheme, removed income caps and waiting lists. First home buyer lending growth picked up after that date, from 3.5% in the year to September 2025 to 22.9% in the year to December, but investor lending was growing faster still until June 2026. The data shows when these things happened together, not whether one caused the other.
Levels, not just growth
Value of new housing loan commitments, indexed to March quarter 2011
Index, March quarter 2011 = 100, value of new loan commitments, original, current prices, excluding refinancing. Source: ABS, Lending Indicators, June quarter 2026, tables 13 and 24.
Growth rates hide the levels. In the June quarter of 2026 investors took out $38.3 billion of new housing loans and first home buyers $18.4 billion, against $12.5 billion and $5.6 billion in the March quarter of 2011. Over the whole period first home buyer lending has grown slightly more, to 331 on the index against 307 for investors, but investors borrow about twice as much in dollar terms.
More loans, or larger ones
Because the spread uses values, it moves with loan sizes. The number of first home buyer loans in the June quarter of 2026 was 30,129, essentially unchanged from a year earlier (−0.1%), while their value rose 9.8%. The average first home buyer loan rose 10.0%, to about $610,000. Investor loans rose 2.5% in number and the average investor loan 5.2%, to about $708,000. So the latest turn in the spread reflects first home buyers borrowing more each, not more first home buyers. Counts of investor loans begin in 2019; since then the count-based spread has pointed the same way as the value-based one in 23 of 24 quarters.
The reading in context
This spread is one of three inputs to Household Finance & Spending (21240), which read +0.0144σ for the March quarter of 2026, close to its 2011 to 2025 average. One of its three inputs, the share of new lending at high debt-to-income ratios, begins in 2019 and rests on 28 quarters, below the platform’s minimum-observation standard. Investor vs. Owner-Occupier Behaviour (21610), which measures investors’ share of new loan commitments by number, read +1.2431σ for the June quarter of 2026. That reading rests on 26 quarterly observations, because the series it uses begins in 2019, which is below the platform’s minimum-observation standard. Household debt relative to income is covered in Household Debt Against Income.
What this does not show
The comparison is of dollar values in current prices, so it mixes the number of loans with their size. It covers new commitments, not the stock of debt, and says nothing about who repays. The lending indicators are revised, and quarters in original terms can move with the timing of commitments. Scheme dates are shown for context; the co-timing of a policy change and a turn in the spread does not establish that one caused the other.
Findings are presented on the basis of data and evidence alone.