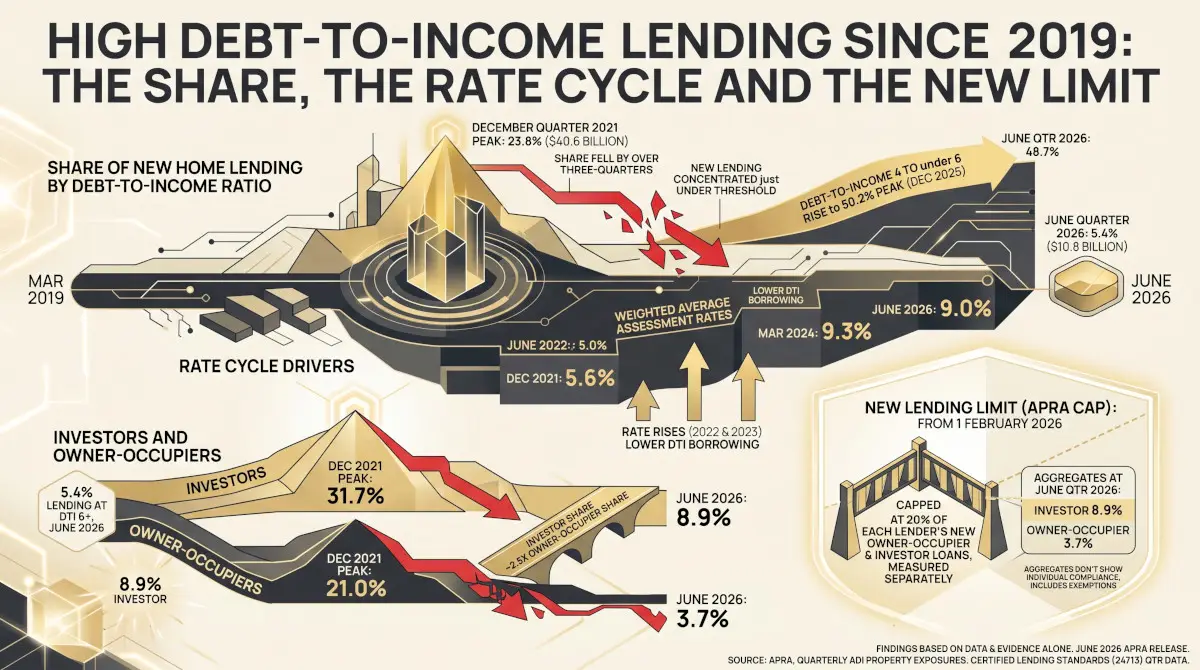

A home loan at six times the borrower’s income or more is what APRA treats as high debt-to-income lending. In the June quarter 2026, 5.4% of new home lending by value was written at that multiple, down from 6.6% in December 2025 and a long way below the 23.8% reached in December 2021, when interest rates were at their lowest. The share fell by more than three-quarters through the 2022 and 2023 rate rises and has stayed between about 5% and 7% since. From 1 February 2026 APRA has capped such lending at 20% of each lender’s new owner-occupier and investor loans. Across all lenders, investors sat at 8.9% in June and owner-occupiers at 3.7%.
The node reading and the lending figures are both at the June quarter 2026, from APRA’s June 2026 release.
What debt-to-income measures
A borrower’s debt-to-income ratio is their total debt, including the new loan, divided by their gross annual income. A household earning $150,000 with $900,000 of debt has a ratio of six. APRA, which supervises the banks and other deposit-taking lenders, collects the value of new home loans written at a ratio of six or more each quarter, and a second band from four to under six. The share of new lending in the high band is one way of seeing how stretched new borrowers are when they take on a loan, which the interest rate on the loan does not show on its own.
The figures here are shares of the value of new loans funded, not of the number of borrowers, and they cover the banks, credit unions and building societies reporting to APRA, other than a small group it classes as ‘other ADIs’. The collection began in March 2019, so the history is seven years long. The share is also the sole input to Lending Standards (24713), a component of the APN Investment Conditions Index™.
Seven years of high debt-to-income lending
Share of new home lending by debt-to-income ratio, by quarter
Per cent of the value of new loans funded, authorised deposit-taking institutions other than those APRA classes as ‘other ADIs’. Source: APRA, Quarterly ADI Property Exposures, June 2026 (released 17 September 2026), Table 1c.
In March 2019, 14.4% of new lending was at a debt-to-income ratio of six or more. The share edged up through 2020 and climbed through 2021 as interest rates fell, to 23.8% in December 2021. At that point new high-ratio loans were worth $40.6 billion in a quarter, out of $171.0 billion of new lending.
It then fell in each of the next 10 quarters, to its low of 4.9% in June 2024, and every quarter since June 2023 has been below 7.5%. The fall coincides with the interest rate rises of 2022 and 2023: a lender tests each borrower at a rate above the loan rate, and when that assessment rate rises, the same income supports a smaller loan, which lowers the debt a borrower can take on relative to income. The weighted average assessment rate lenders used rose from 5.6% in December 2021 to 9.3% in March 2024, and was 9.0% in June 2026.
The band below it moved the other way. Loans at four to under six times income made up 43.2% of new lending in December 2021 and 50.2%, the highest in the series, in December 2025. Borrowing has concentrated just under the high-ratio threshold rather than above it.
Investors and owner-occupiers
Share of new lending at a debt-to-income ratio of six or more, investor and owner-occupier
Per cent of the value of new term loans funded in each category. The dotted line marks APRA’s 20% limit, in force from 1 February 2026. The limit applies to each lender separately and excludes bridging loans and loans for new dwellings, which these aggregate figures include, so the lines are not a test of compliance. Source: APRA, Quarterly ADI Property Exposures, June 2026, Table 1c.
Investors borrow at high ratios more often than owner-occupiers, and have in every quarter since 2019. At the December 2021 peak, 31.7% of new investor lending was at six times income or more, against 21.0% for owner-occupiers. In June 2026 the figures were 8.9% and 3.7%: the investor share is nearly two and a half times the owner-occupier share.
The first quarters under the limit
APRA announced the limit on 27 November 2025, when it said the limit was not currently binding at the aggregate level and was not expected to affect borrowers’ access to credit in the near term. The investor share had risen in each of the three quarters to December 2025, from 8.2% in March 2025 to 11.5%.
| Date | Prudential decision |
|---|---|
| 5 July 2019 | APRA replaces the 7% minimum assessment rate with a serviceability buffer of 2.5 percentage points above the loan rate |
| 6 October 2021 | The buffer rises to 3.0 percentage points |
| 27 November 2025 | APRA announces a limit on lending at a debt-to-income ratio of six or more: up to 20% of each lender’s new owner-occupier lending and 20% of its new investor lending, measured separately |
| 1 February 2026 | The limit takes effect. Bridging loans for owner-occupiers and loans to buy or build new dwellings are exempt |
| Quarter | All new lending | Owner-occupier | Investor | Assessment rate used |
|---|---|---|---|---|
| June 2025 | 5.3% | 3.7% | 8.7% | 8.9% |
| September 2025 | 5.9% | 3.8% | 10.0% | 8.6% |
| December 2025 | 6.6% | 4.1% | 11.5% | 8.5% |
| March 2026 | 6.2% | 3.9% | 10.8% | 8.7% |
| June 2026 | 5.4% | 3.7% | 8.9% | 9.0% |
Shares of the value of new lending at a debt-to-income ratio of six or more. Assessment rate: the weighted average rate lenders used to test serviceability on new loans. Source: APRA, Quarterly ADI Property Exposures, June 2026, Table 1c.
In the two quarters since, the investor share fell to 8.9% and the overall share to 5.4%. Two things changed at once. The limit took effect in February, and the weighted average variable rate on new loans rose from 5.5% in December 2025 to 6.2% in June 2026, taking the average assessment rate from 8.5% to 9.0%. The rate rises alone would be expected to lower the share, as they did in 2022 and 2023. Two quarters of data cannot separate the two effects.
Value of new loans at a debt-to-income ratio of six or more, by quarter
Billions of dollars, authorised deposit-taking institutions other than those APRA classes as ‘other ADIs’. Not adjusted for inflation. Gold marks the latest quarter. Source: APRA, Quarterly ADI Property Exposures, June 2026, Table 1c.
In dollars, new high-ratio lending was $10.8 billion in the June quarter 2026, out of $200.5 billion in total, about a quarter of its value at the December 2021 peak while total new lending was higher.
What this does not show
The shares are aggregates across lenders. APRA’s limit applies to each lender separately, and APRA said when it announced the limit that only a small number of lenders were expected to be near the investor limit, which an aggregate cannot show. The figures include bridging loans and loans for new dwellings, which the limit exempts. A high ratio is not in itself a sign that a borrower will struggle: it says nothing about their savings, other assets or the loan-to-valuation ratio. The collection began in 2019, which is too short a history to compare the current share with a full cycle. The debt-to-income ratio of the household sector as a whole, rather than of new loans, is covered in Household Debt Against Income: Where the Ratio Stands After the Rate Cycle, and the serviceability buffer in The Serviceability Buffer: Three Settings Since 2014.
Findings are presented on the basis of data and evidence alone.