Accelerating Insolvencies: The Structural Reallocation within Australia’s Construction Sector
APN ANALYSIS: A-260204-AUS136668
Executive Summary
The Australian residential construction sector has entered a phase of progressive structural deterioration, marked by a structurally significant acceleration in corporate insolvencies. In the first half of the 2026 financial year alone, 1,792 construction firms entered insolvency proceedings, a figure that confirms the structural pressure point is not a cyclical downturn but a systemic consolidation. This material valuation correction is driven by a material liquidity constraint, where the Reserve Bank of Australia’s February 2026 cash rate hike to 3.85% acted as the final catalyst. The rate rise dismantled the leveraged cashflow models used by undercapitalised builders to mask insolvency, triggering a systemic payment freeze and forcing a wave of liquidations.
For property professionals, this marks the end of the low-cost, fixed-price building era. The market is undergoing a material consolidation, with the assets of failed mid-tier builders being transferred to “patient capital” investors and surviving Tier 1 contractors at distressed values. This Structural Reallocation is fundamentally repricing construction risk, timelines, and costs upwards. The key strategic implications involve de-risking development pipelines, identifying opportunities in distressed assets, and recalibrating client advice to reflect a market now dominated by a smaller pool of highly capitalised, and more expensive, major operators.
Background & Strategic Context
This event validates and calibrates APN’s core macro-theses on market causation and segmentation. The contraction of the mid-tier construction class is not a random market failure but a direct consequence of state-level intervention creating a credit-based liquidity shock, which in turn results in a reallocation of capital from the operational class to the capital class. The structural pressure point provides a clear case study in how macro-prudential and monetary policy physically reshape an industry.
A State-Level Trigger Event (APN Sovereign Policy Composite Index™ (SPCI, 24800)): The RBA’s decision to lift the cash rate to 3.85% was a state intervention designed to curb inflation. For the construction sector, it was a structural catalyst, not merely increasing costs but reducing the sales velocity required to sustain highly leveraged cashflow models. This demonstrates the primacy of state actors in defining the boundaries of market viability.
The Cashflow-Based Rationing Regime (Project Iron Gate): The rate hike constrained the “Iron Gates” of credit for new home buyers, constraining builders from the deposits needed for liquidity. Simultaneously, the industry’s internal credit system seized up, as evidenced by 44-day payment delays. This confirms the `APN Credit Rationing Index™` thesis that access to cashflow, not collateral, is the ultimate determinant of survival.
A Material Capital Reallocation: The mass failure of SME builders and the subsequent liquidation of their unfinished projects represents a direct capital reallocation. The working capital and embedded equity created by the builder class are being acquired at a steep discount by distressed asset funds and Tier 1 operators, illustrating the structural mechanism of capital concentration.
The Viability Chasm (APN Residual Land Value (RLV) Gap™): The liquidation of half-built sites creates a gap between the end-market value and the now-inflated cost-to-complete. This `APN RLV Gap™` is the precise mechanism through which the capital reallocation occurs, as it forces asset sales at values far below the sum of their parts, creating the discount for “patient capital” to exploit.
Deconstruction of the Source Event
This deconstruction is based on an internal APN intelligence briefing, analysing corporate insolvency data and industry financial metrics as of February 2026. The key facts are:
- Affected Cohort Count: A verified 1,792 construction companies entered external administration in H1 FY26 (1 July 2025 – 31 December 2025).
- Record Velocity: This insolvency rate is tracking to meet or exceed the previous financial year’s record of 3,596 failures, indicating the structural pressure point is accelerating or maintaining a peak velocity, not receding.
- Sectoral Concentration: The construction industry accounts for a disproportionate 26-27% of all corporate insolvencies in Australia, highlighting a sector-specific pathology rather than a general economic malaise.
- The Trigger Event: The RBA’s cash rate hike to 3.85% on 3 February 2026 is identified as the terminal event that broke the deposit-reliant cashflow cycle for many builders.
- The Codex Structural Adjustment: B2B payment defaults have accelerated, with average payment delays in the construction sector increasing to 44 days overdue. This indicates a systemic liquidity freeze, with suppliers withdrawing credit and shifting to Cash on Delivery (COD) terms, materially constraining builders of working capital.
Critical Analysis & Balanced View
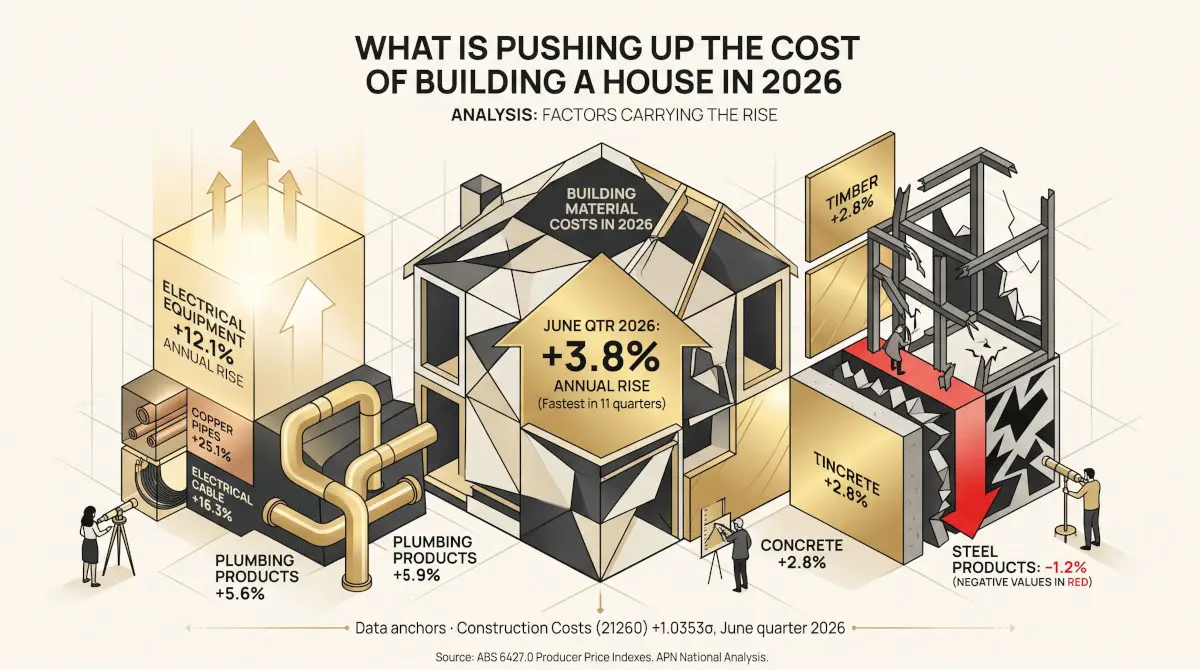
The central paradox of this structural pressure point is that insolvencies are accelerating even as input cost inflation begins to normalise. This reveals the primary driver is not cost escalation, but liquidity exhaustion. Builders who survived the initial price shocks of 2022-23 by accumulating debt and deferring liabilities are now succumbing to a material lack of cash. The stabilisation of costs does not fully represent the underlying condition; prices have plateaued at a structurally higher base, making legacy fixed-price contracts structurally unviable.
A critical secondary driver is the “Labour Ratchet.” While material prices have softened, elevated competition for skilled labour from government-backed infrastructure projects has driven wages higher. This prevents overall project costs from falling, ensuring that the financial pressure on residential builders remains concentrated. Furthermore, the structural pressure point has evolved beyond input costs to time costs. Labour shortages are causing significant project delays, and in a high-interest-rate environment, these time overruns generate unrecoverable holding costs that erode and eliminate profitability even on correctly priced new projects.
The balanced view is that this material valuation correction is also a selective market consolidation. It is selectively removing from the industry undercapitalised, legacy highly leveraged entities that operated on unsustainable business models. This structural consolidation, while materially adverse, is clearing the way for a more consolidated and resilient market. The survivors, primarily Tier 1 contractors with deep balance sheets, will inherit a market with fewer competitors, enabling them to enforce higher margins and more favourable contract terms (e.g., Cost Plus). The market is not contracting in aggregate; it is being consolidated and repriced.
Strategic Implications for Property Professionals
- For Developers: The era of relying on low-cost, fixed-price contracts with mid-tier builders is over. Feasibility studies must be immediately recalibrated to account for higher Tier 1 contractor costs, longer construction timelines, and the inclusion of significant contingency buffers. Securing partnerships with builders who possess balance sheet depth is now the primary project de-risking strategy.
- For Investors & Distressed Asset Funds: The wave of 1,792+ insolvencies has created a generational buyer’s market for distressed construction assets. A significant opportunity exists to acquire partially completed projects and land banks where the `APN RLV Gap™` is widest. Success requires liquid capital and the expertise to accurately price rectification and completion risk.
- For Agents & Buyers’ Agents: Client counsel must now include rigorous due diligence on developer and builder solvency. The “flight to quality” extends to project delivery. Prioritise completed or near-completed stock and projects backed by Tier 1 builders. The risk of off-the-plan purchases from smaller entities is now elevated.
- For Lenders & Valuers: Risk models for construction finance require revision. Scrutiny must shift from the gross value of a project pipeline to the builder’s net liquidity, balance sheet strength, and access to non-bank credit. The withdrawal of trade credit insurance on a builder should be treated as a material indicator signalling imminent failure.
APN Index Management
The APN Codex 24000 Series is a proprietary set of indices that translates complex market forces into measurable metrics. This section outlines how the preceding analysis is validated against, and informs the calibration of, these frameworks.
- Validation: This analysis provides validation for the `Project Iron Gate` thesis, demonstrating how an `APN Sovereign Policy Composite Index™ (SPCI, 24800)` action (RBA monetary policy) triggered a structurally significant liquidity failure. It confirms the `APN RLV Gap™ (24410)` as the core mechanism facilitating the capital reallocation from the operational class (builders) to the capital class (investors).
- Index Calibration: The `APN Credit Rationing Index™ (24230)` is recalibrated to increase the weighting of B2B payment velocity and trade credit insurance availability as primary leading indicators of sectoral insolvency risk. The `APN RLV Gap™ (24410)` calculation is adjusted to incorporate a higher risk premium for project remediation and completion by a successor builder.
- Data Capture: This analysis triggers a new data capture mandate for the `APN Symbiotic Intelligence Network™ (24310)`. The mandate is to track and quantify the transaction values of liquidated construction assets to build a historical database of the “40-60 cents on the dollar” extraction value, and to monitor the change in market share concentration towards Tier 1 contractors.
Disclaimer
The analysis and information contained in this deconstruction are for general informational and strategic purposes only and do not constitute financial, investment, legal, or any other form of professional advice. The Australian Property Network (APN) is a strategic intelligence organisation and is not a licensed financial advisor.
This analysis is based on data and information from third-party sources believed to be reliable; however, APN provides no warranty as to its accuracy, currency, or completeness. Images used in this analysis are for illustrative and conceptual purposes only and may not represent real persons, properties, or events.
All frameworks (Codex 24100-24800) are proprietary to APN.
Property values and market conditions can go up or down. Before making any property or investment decisions, you must conduct your own thorough research and seek independent professional advice tailored to your specific circumstances.