
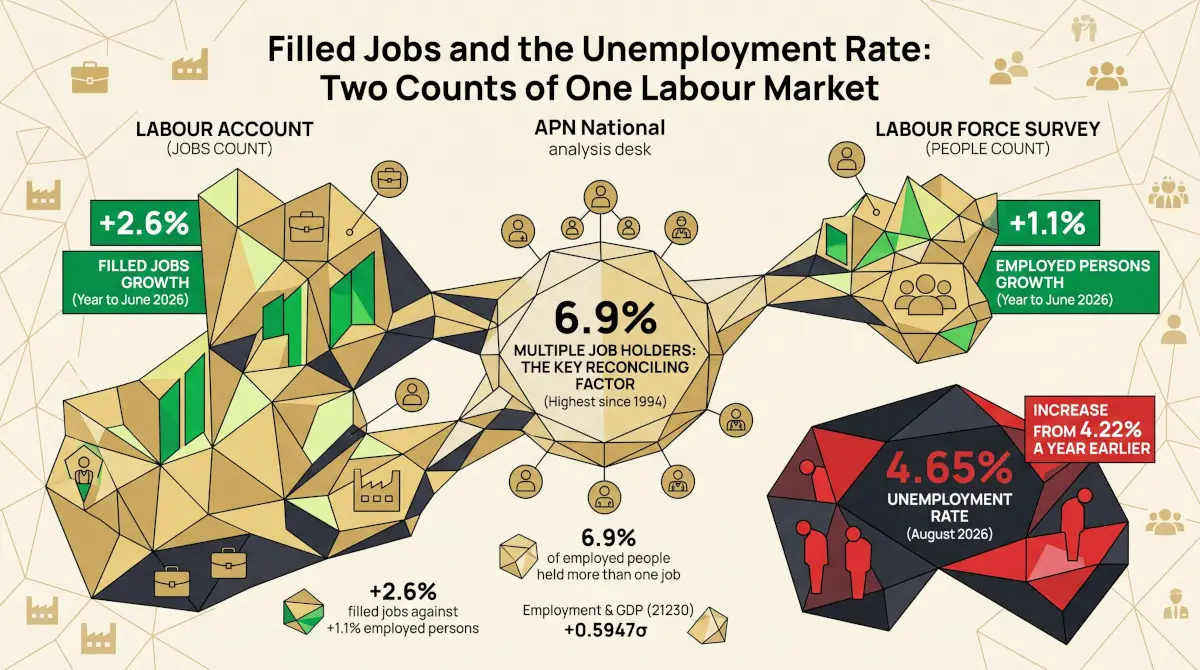

Australia has two official counts of work. The Labour Account counts jobs; the Labour Force Survey counts people. Over the year to the June quarter of 2026 they told different stories. Filled jobs rose 2.6%, faster than the year before. The number of people employed, as the Labour Force Survey measures it, rose 1.1%, more slowly than the year before, and unemployment rose to 4.65% in August, from 4.22% a year earlier. Much of the difference is people taking on second jobs: 6.9% of employed people held more than one, the highest share in the series.
Seasonally adjusted. Labour Force figures carry the ABS 2026 survey transition disclosure set out below.
Jobs and people
A job and a person are different units. One person can hold a main job and a second one, so the number of jobs is always larger than the number of people in work. The Labour Account, which the ABS assembles from several sources, including household and business surveys, counts filled jobs and splits them into main jobs and secondary jobs. Each employed person has one main job, so filled jobs equal employed persons plus secondary jobs. The Labour Force Survey is a monthly household survey that asks people whether they worked, which is the source of the unemployment rate. The two also define employment slightly differently, so their levels differ as well as their growth. A fuller explanation of how the measures are built is in the APN Codex entry Employment and the Labour Market.
Where the two counts part
Filled jobs and employed persons, indexed to June quarter 2019
Index, June quarter 2019 = 100, seasonally adjusted, June quarter 2015 to June quarter 2026. Labour Force Survey employment is the average of the three months in each quarter. Source: ABS, Labour Account Australia, June 2026, table 1; ABS, Labour Force, Australia, August 2026, table 1.
From mid-2019 the three lines moved together through the pandemic fall and the recovery. Filled jobs ran ahead between 2021 and 2023, by up to 1.8 index points in December 2021, but by June 2025 the three were within about half a point of one another. They have separated again since: by June 2026 filled jobs stood 2.0 points above Labour Force Survey employment, the widest gap since mid-2019. Between the June quarters of 2025 and 2026, filled jobs rose by about 410,000 (2.6%), the Labour Account’s count of employed persons by about 288,000 (1.9%), and Labour Force Survey employment by about 160,000 (1.1%).
A year earlier the order was reversed: filled jobs rose 1.4% and Labour Force Survey employment 2.1%. On the jobs count, growth picked up in 2025–26; on the people count, it slowed.
Annual growth in filled jobs less annual growth in Labour Force Survey employment
Percentage points, year to each quarter, September quarter 1995 to June quarter 2026. Positive values mean filled jobs grew faster than employed persons. Seasonally adjusted. Source: ABS, Labour Account Australia; ABS, Labour Force, Australia.
A gap of 1.48 percentage points is unusual. It is the second largest since 1995, behind only the September quarter of 2022 in the reopening, and the widest outside 2021 to 2023.
Second jobs
Multiple job holders as a share of employed persons
Per cent, seasonally adjusted, September quarter 1994 to June quarter 2026. Source: ABS, Labour Account Australia, June 2026, table 1.
Because each employed person holds one main job, the difference between the jobs count and the people count is the number of secondary jobs. Over the year to June 2026 secondary jobs rose 11.7%, by about 122,000, and made up about 30% of the growth in filled jobs, although they were only 6.5% of all jobs a year earlier. About 1.05 million people held more than one job in the June quarter, 6.9% of the employed, up from 6.4% a year earlier and 5.7% in mid-2019. The rise of 0.40 points in the June quarter alone was the fourth largest quarterly increase since 1994.
The data does not show why more people hold a second job. The latest quarter is a first estimate, and Labour Account estimates are revised as source data is updated.
The unemployment rate
Unemployment rate, Australia
Per cent, seasonally adjusted, monthly, January 2019 to August 2026. Source: ABS, Labour Force, Australia, August 2026, table 1.
On the people count, the labour market has eased a little. The unemployment rate was 4.65% in August 2026, against 4.22% a year earlier and 4.08% in January 2026. The participation rate was 67.1%, below its peak of 67.2% in January 2025. The share of jobs left vacant has also eased: job vacancies were 2.02% of filled jobs in the June quarter, from 2.12% a year earlier. How the rise in unemployment was spread across regions is set out in Regional Unemployment: Where the Past Year’s Rise Actually Landed, and construction employment in Jobs in the Building Trades.
Where they agree, and where they differ
Both counts say that employment is still growing, and neither shows a fall. They differ on pace. The jobs count shows growth picking up; the people count shows it slowing, with unemployment a little higher. The two are reconciled by more people holding more than one job, so that the number of jobs has grown faster than the number of people working them.
The Employment & GDP (21230) reading of +0.5947σ for the June quarter needs the same care. It averages four inputs. Two are levels that grow over time, filled jobs (+2.07σ) and GDP in chain volume terms (+1.81σ), and a growing level measured against a fixed 2011 to 2025 average reads high by construction; it does not by itself indicate a tight labour market. The two unemployment inputs, national and regional, read −0.76σ and −0.74σ: unemployment remains below its 2011 to 2025 average, although it has risen over the past year. For how tight the labour market is, the unemployment inputs are the better guide.
Limits of the comparison
The Labour Account and the Labour Force Survey define employment differently and draw on different sources, so their levels are not directly comparable and their growth rates can differ for technical reasons as well as economic ones. The Labour Force Survey has also been in transition while the ABS modernised it. The ABS reports that the August 2026 release completes that program: all rotation groups have moved to the new systems and questionnaire, with the standard rotation pattern resuming from August. It adjusted the weighting of about 2.7% of the August sample, in one rotation group in Victoria, and notes that August estimates may carry some additional variability from changes to its supplementary survey collection. Small monthly movements should be read with the survey’s standard errors in mind. The most recent Labour Account quarter will be revised.
Findings are presented on the basis of data and evidence alone.


