Spending on building and renovating homes is a small part of the economy, a little over five cents in every dollar. In the June quarter of 2026 private dwelling investment reached $38.1 billion in volume terms, the highest in the ABS series. Over the year to June it added about 0.31 percentage points to GDP growth of 2.14%, roughly a seventh of the total. The high rests on renovation: alterations and additions are at their highest, while the building of new dwellings remains 6.7% below its 2018 peak. New dwellings supplied most of the rise since the December quarter 2023 low; what lifts the total above its 2018 level is renovation.
Seasonally adjusted. Chain volume measures remove price change; shares of GDP use current prices.
What dwelling investment measures
In the national accounts, dwelling investment is spending on the construction of new homes and on alterations and additions to existing ones, counted as private gross fixed capital formation on dwellings. It counts work as it is done, not when a home is approved, started or finished. The ABS publishes it two ways. The chain volume measure strips out price change, so it shows how much building was done. The current price measure is what was spent, and it is the right one for comparing dwelling investment with the size of the economy.
Its share of the economy
Private dwelling investment as a share of GDP
Per cent, financial years to June, 1960–61 to 2025–26, current prices, calculated from seasonally adjusted quarterly estimates. Source: ABS, Australian National Accounts, June quarter 2026, table 3.
Dwelling investment was 5.46% of GDP in 2025–26, up from 4.92% in 2019–20 and the highest share since 2017–18. It remains below the 5.86% of 2015–16 and well below the 6.59% of 2003–04, the highest in the series. Part of the recent rise in the share is price. In 2025–26 dwelling investment grew 8.5% in current prices against 5.4% in volume, so rising building costs account for part of the larger share.
| Year to June | Dwelling investment, volume | GDP, volume | Contribution to GDP growth (points) | Share of GDP, current prices |
|---|---|---|---|---|
| 2020–21 | +14.5% | +10.2% | +0.79 | 4.95% |
| 2021–22 | −3.6% | +3.8% | −0.20 | 5.03% |
| 2022–23 | +0.9% | +2.2% | +0.05 | 5.04% |
| 2023–24 | −1.0% | +0.9% | −0.05 | 5.07% |
| 2024–25 | +5.5% | +1.9% | +0.28 | 5.31% |
| 2025–26 | +5.8% | +2.1% | +0.31 | 5.46% |
Private gross fixed capital formation on dwellings. Volume growth is June quarter on June quarter; contributions are calculated from chain volume levels and are approximate; shares are for the financial year. Seasonally adjusted. Source: ABS, Australian National Accounts, June quarter 2026, tables 2 and 3.
Its contribution to growth
Contribution of private dwelling investment to quarterly GDP growth
Percentage points, September quarter 2015 to June quarter 2026, chain volume, seasonally adjusted. Calculated as the change in dwelling investment divided by the previous quarter’s GDP; chain volume components are not strictly additive, so the contributions are approximate. Source: ABS, Australian National Accounts, June quarter 2026, table 2.
Since 2021 the direction of dwelling investment has changed twice. It rose to a high in the September quarter of 2021, then fell 6.2% to a low in the December quarter of 2023. It subtracted from growth in 2021–22 and 2023–24. Since then it has risen 14.1%, and it increased in seven of the last eight quarters. In each of the past two financial years it added close to 0.3 percentage points to GDP growth: 0.28 in 2024–25 and 0.31 in 2025–26.
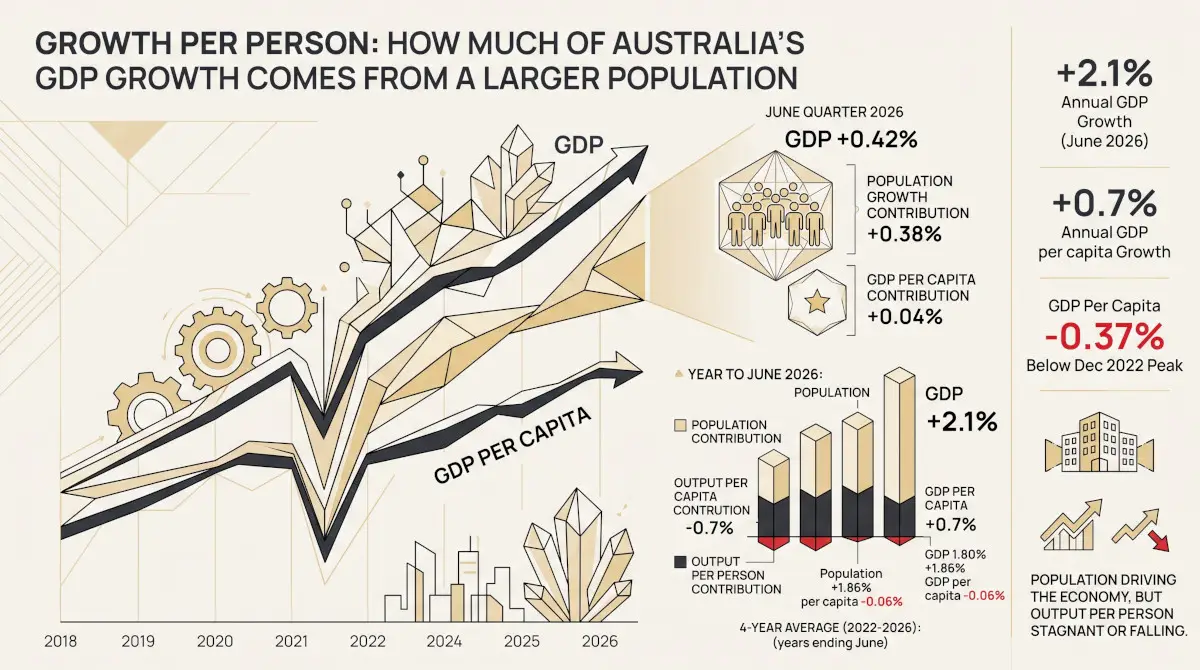
Over the five years from June 2021, dwelling investment grew 7.6% in volume, less than the 11.5% growth in GDP as a whole. The broader question of how housing competes with other construction for labour and capacity is taken up in Crowded Out: Housing Is Losing the Contest for Australia’s Construction Capacity; the relationship between GDP and population growth in Growth Per Person.
New homes and renovation
Private dwelling investment by type, chain volume
$ billion per quarter, chain volume measures, seasonally adjusted, March quarter 2000 to June quarter 2026. Source: ABS, Australian National Accounts, June quarter 2026, table 2.
The two parts of dwelling investment have followed different paths. Investment in new and used dwellings peaked at $25.3 billion a quarter in June 2018 and was $23.7 billion in June 2026, 6.7% lower. Alterations and additions reached $14.4 billion, their highest level. Renovation accounted for 37.6% of dwelling investment spending in the June quarter, up from 31.7% in mid-2019. The national accounts measure the value of work done; they do not show how many new homes that work represents, and a high in dwelling investment is not a high in new housing.
The reading in context
Employment & GDP (21230) read +0.5947σ for the June quarter of 2026. One of its inputs is the level of GDP in chain volume terms, which grows over time and reads high against a fixed 2011 to 2025 average by construction; the reading is not a measure of how fast the economy is growing. Construction Costs & Supply Chain (21260) read +1.0353σ for the same quarter.
What this does not show
These are national totals of private spending. They exclude public investment in dwellings, do not show how activity is divided between states, and measure the value of work done rather than the number of homes built. Contributions to growth are approximations calculated from chain volume levels. The June quarter is the first estimate for that quarter and will be revised.
Findings are presented on the basis of data and evidence alone.