Construction work in Australia filled 1.35 million jobs in the June quarter of 2026, 4.9% more than a year earlier in seasonally adjusted terms. On the ABS state estimates, the industry has added about 157,500 jobs since mid-2021, a rise of 13.2%, with Victoria and Queensland accounting for most of the increase. Demand for more workers has eased at the same time: construction job vacancies equalled 1.48% of filled construction jobs in the June quarter, down from a peak of 3.27% in mid-2022 and below the rate across all industries of 2.02%.
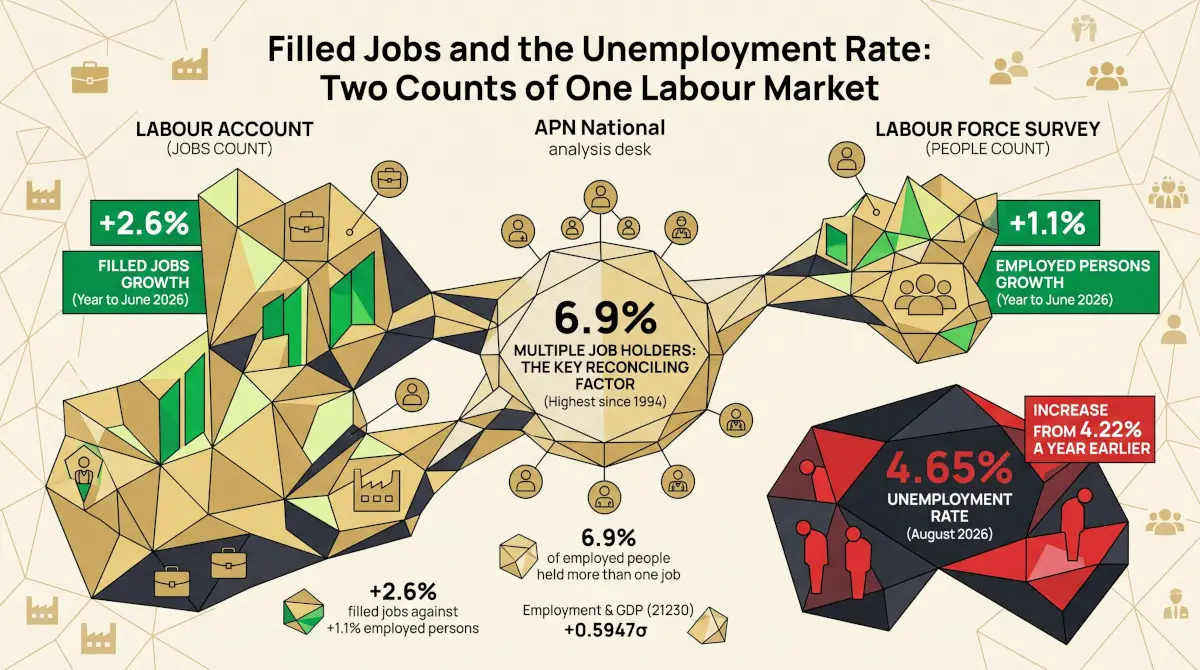
The σ figure is APN’s certified reading for that condition: how far it sits from its 2011–2025 average, measured in standard deviations. It combines unemployment with growing measures such as output and filled jobs, which sit above a fixed long-run average as the economy expands, so a positive reading is not on its own a sign of a tight labour market.
Counting jobs in construction
The ABS Labour Account counts filled jobs — positions occupied by a worker, including second jobs — by combining estimates drawn from household and business data. Construction here covers the whole industry: residential and commercial building, engineering and infrastructure work, and the construction trade services such as electrical, plumbing and carpentry businesses. The ABS publishes national estimates by industry in seasonally adjusted terms, and modelled estimates of filled jobs by industry for each state and territory that are not seasonally adjusted. The national headline figures in this piece are the seasonally adjusted estimates; the longer-run, share and state comparisons use the sum of the state and territory estimates.
More construction jobs than in 2021
On the sum of the state estimates, filled construction jobs rose from 1.19 million in the June quarter of 2021 to 1.35 million in the June quarter of 2026. Growth was uneven: the count dipped in the March quarter of 2023, to 1.19 million, then rose with little interruption through 2024 and 2025. In seasonally adjusted terms, the ABS estimates 1,354,800 construction jobs in the June quarter of 2026, 4.9% more than a year earlier and a faster rise than the 2.6% increase in filled jobs across all industries.
Construction filled jobs, sum of state and territory estimates, millions, 2011–2026
Source: ABS Labour Account Australia, modelled estimates of filled jobs by state, territory and industry, construction (ANZSIC division E), sum of states and territories, not seasonally adjusted, September quarter 2011 to June quarter 2026.
Over the full five years to June 2026, however, construction grew a little more slowly than the rest of the economy: filled jobs across all industries rose 14.9%, against 13.2% in construction. As a result construction’s share of all filled jobs, 8.27% in the June quarter of 2026, sits exactly on its 2011–2025 average of 8.27%. The share was highest at the start of the series, 8.97% in the September quarter 2011, and lowest at 7.75% in the March quarter 2023.
Construction share of all filled jobs, %, 2011–2026
Source: ABS Labour Account Australia, modelled estimates by state, territory and industry, not seasonally adjusted; construction filled jobs as a share of filled jobs across all industries, both summed across states and territories. The dotted line marks the 2011–2025 average of 8.27%.
Where the new jobs are
The increase since mid-2021 has been concentrated in three states. Victoria added 63.2 thousand construction jobs (21.4%) and Queensland 55.7 thousand (22.1%), and South Australia’s 17.6 thousand was the largest proportional rise, at 26.1%. New South Wales, which holds the largest construction workforce with 29.2% of the national total, added 5.8 thousand jobs, or 1.5%.
Change in construction filled jobs by state and territory, June quarter 2021 to June quarter 2026, thousands
Source: ABS Labour Account Australia, modelled estimates of filled jobs by state, territory and industry, construction, not seasonally adjusted. Percentage change shown in brackets. State and industry estimates are modelled by the ABS from its national totals.
Vacancies have fallen back
Filled jobs show how many people construction employs; job vacancies show how many more employers are trying to hire. The ABS job vacancies survey counted 19.9 thousand vacancies in construction in May 2026, about half the 39.9 thousand of May 2022. Expressed as a share of filled construction jobs, the construction vacancy rate was 1.48% in the June quarter of 2026, below its 2011–2025 average of 1.62% and close to its 2019 average of 1.44%.
Job vacancy rate, construction and all industries, % of filled jobs, 2011–2026
Sources: ABS Job Vacancies Australia (construction vacancies in original terms; all-industry vacancies seasonally adjusted) and ABS Labour Account Australia (construction filled jobs from the state and territory estimates, not seasonally adjusted; all-industry filled jobs seasonally adjusted); vacancies divided by filled jobs in the matching quarter. Dotted lines mark 2011–2025 averages: construction 1.62%, all industries 1.77%.
Construction vacancies rose further and faster than vacancies across the economy in 2021 and 2022, when the construction rate reached 3.27% against 3.18% for all industries. They have also fallen further since. The construction rate has been below the all-industry rate in every quarter since the start of 2024, and the all-industry rate of 2.02% remains above its own long-run average of 1.77%. Construction vacancies are estimated from a sample of employers, so small movements from one quarter to the next can reflect sampling variation rather than a change in hiring.
Reading the comparison
The construction workforce has grown by about 13% since mid-2021, and the pressure to hire has eased from its 2022 peak to around its pre-pandemic level. The industry has grown at close to the pace of the economy as a whole, so its share of jobs is unchanged from its long-run average, and the recent growth has come mainly from Victoria, Queensland and South Australia rather than New South Wales. A lower vacancy rate alongside rising employment is consistent with employers filling positions that were open in 2022; it does not by itself show how much work is in the pipeline. How the work is divided between housing, other building and engineering is examined in APN’s analysis of construction capacity. The figures describe the labour market to June 2026; they do not indicate how it will move next.
Findings are presented on the basis of data and evidence alone.